cannot reproduce Image integration efficiency with huge stacks

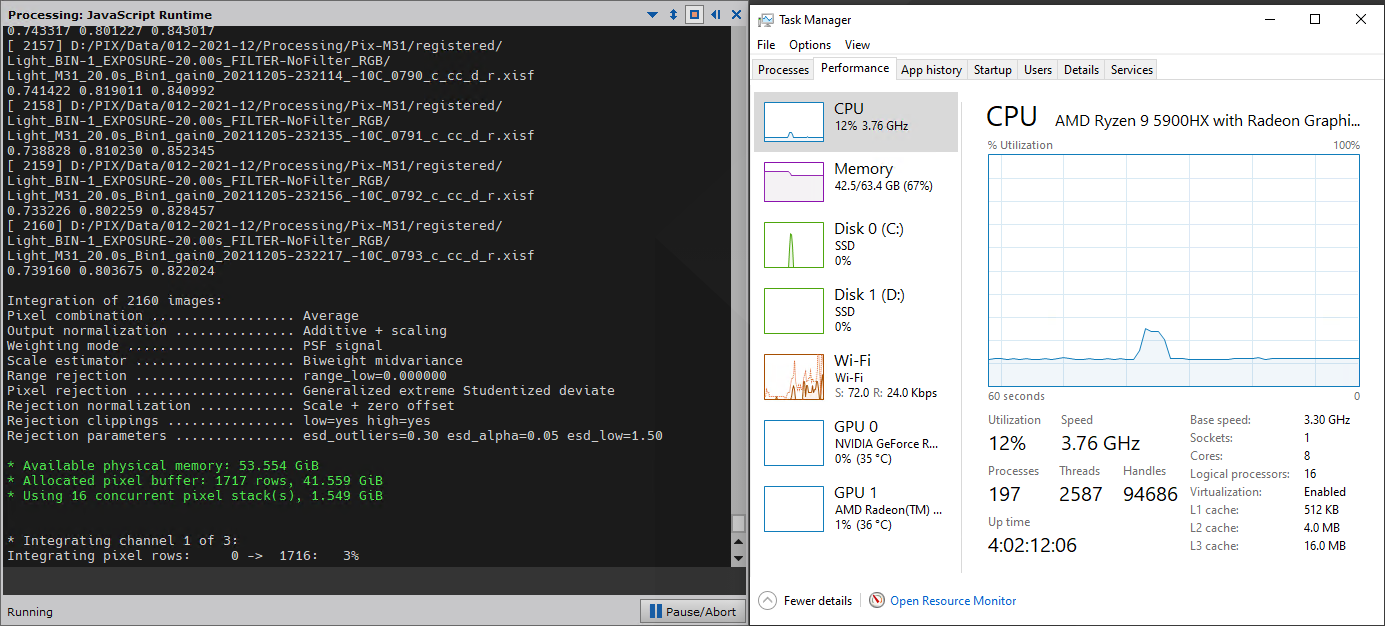
Something is still wrong with the integration process. Today I'm trying to integrate over 2000 images as part of WBPP process and CPU usage is at 12%. Last time, when I tried to integrate 1200 images, CPU usage was 33%. So, more images you integrate, less CPU PI uses. :(

1638820357675.png
 
I cannot reproduce this problem on our working machines running Linux. I'll try to make some tests on Windows as soon as possible.

Anyway, it is evident that more memory is required to perform these tasks with huge datasets. With only 16 pixel stacks the integration process is necessarily very slow for 2160 images, especially using a complex rejection algorithm such as GESD. I strongly recommend a minimum of 128 GB of RAM in this case.
 
Last time I was able to solve this issue by deleting swap files from PI temp folders and restarting PC. WBPP produced master light file out of 1200 images using 100% CPU during integration. This time same trick did not work. Second attempt to run WBPP from start to finish failed again with 15% CPU utilization when integration started. On first screenshot below, first deep below 100% happened when Green message showed up in the log, then it went up and down two times and finally settled on flat 15% within couple minutes (second screenshot below).
I bought this new PC as powerful as I could effort to be able to stack thousands of images (just to use with PI). Only PI is installed there and nothing else, not even MS office and such. PC scores 21000 in PI benchmark test but the integration uses 15% CPU and at that rate it would be unrealistic to wait until the end.
Any advice?

1638841209888.png


1638841438378.png
 
Reporting my observations again, hopefully it will help to find the problem.
I had to stop WBPP during "slow" integration phase. Restarted PC and this time started Image integration process separately based on registered files left from the previous uncompleted WBPP run. It runs now at 100% CPU. It seems that processes that WBPP runs before integration somehow affect the last integration step. In my case these are calibration, cosmetic correction, debayering, registration. Could this be that one of those processes do not properly terminate and hold PC resources somehow? Like Subframe Selector if you don't close it properly.
 
when running ImageIntegration separately, what does the console say for those two green lines? is the memory allocation different?
 
interesting, very similar. ok - i had wondered if the automatic partitioning between the buffer and stacks was maybe suboptimal. but it seems that there is some other factor at play here.
 
The ImageIntegration process does not use any temporary or working files on disk, so the existence of swap or temporary files cannot have any direct influence because, besides loading input files, everything happens in RAM.

PixInsight automatically removes all swap and temporary files it creates when the application terminates execution, so there should be no swap files at all after you exit the application, unless it has crashed, which is a very anomalous situation.

What can cause severe performance penalties on Windows (NTFS) is filesystem fragmentation. If disk I/O operations become very slow, they prevent efficient usage of CPU cores because of long I/O wait states. This is severely aggravated by the lack of memory resources. With only 16 pixel stacks the ImageIntegration process has to be reading disk data by small chunks thousands of times for each input file, which is tremendously inefficient. So we have a combination of factors here: lack of RAM and the use of NTFS which is, how to say, not the very best filesystem in the world. The only effective solution is adding more RAM to your machine. To work with very large datasets like these I recommend a minimum of 128 GB.
 
I found a solution for myself: Use WBPP on large datasets with all steps except the integration and then run integration process separately. In this case imageintegration uses 100% CPU and successfully completes its task.
If trying to integrate as part of WBPP, integration process fails to utilize 100% of CPU and works in crippled 15-30% mode.
 
is it possible that the JS engine is holding on to a bunch of memory, thus when run from WBPP, ImageIntegration causes the windows VM system to start paging like crazy?

rob
 
It does not seem that something is holding the memory. In both cases same amount of memory is allocated for integration. There is no disk usage as well during the execution, so it is not paging much. It almost looks like something is holding CPU threads/cores (if it makes sense at all) not allowing CPU to work under 100% load.
 
well PI seems to be looking for how much physical memory there is so even if a bunch is already allocated it seems like ImageIntegration is not going to take into account how much virtual memory is already used. that's why i asked. but if there's no disk usage at all then i guess it can't be the problem. at any rate it should not thrash since the JS engine is never going to try to access anything while ImageIntegration is running, but i figured there might be some paging penalty along the way.
 
I can confirm that the same thing happens to me with a Ryzen 5800X and 64GB of RAM. When I have a stack of 1000+ subs and I use WBPP to integrate it goes very slowly and uses only ~30% CPU. When I have WBPP end without doing integration and then integrate separately using the same settings it uses 100% CPU and completes hours faster. No change in RAM in the system between the two obviously, so there is more to this than just saying use Linux to avoid NTFS or add more RAM. This didn't happen to me on -8 which I was using before updating to -11. Perhaps it has something to do with the PSF weighting algorithms that are new?
 
well PI seems to be looking for how much physical memory there is so even if a bunch is already allocated it seems like ImageIntegration is not going to take into account how much virtual memory is already used. that's why i asked. but if there's no disk usage at all then i guess it can't be the problem. at any rate it should not thrash since the JS engine is never going to try to access anything while ImageIntegration is running, but i figured there might be some paging penalty along the way.

Hi rob,

umh, sorry... as I observed myself, PI is keen in looking and taking into account how much virtual memory is already used.
Due to running PI on a rather slow processor (i7-2600, 4x2 logical processors) still today, I am very interested on usage of system resources and like to have xosview (yes, running PI on Linux) showing e.g. usage of CPU, memory, disk i/o, swap, paging activity, ints and IRQs while I let run several image processing steps w/ not so much image files (e.g. only 40 to 50), but each of the files around 500MB in size.
When running PI on a rather fast Ryzen 4700U w/ only 16GB of RAM, I often got a message on memory constraints and thus reduced processing threads. But these messages only show up once, and are scrolled away fast (and that's why I set maximum number of console lines to 16000, to get a clue about problem reasons ;-) ).
I never saw memory constraints on the i7 w/ 32GB of RAM, however. Sounds like 4GB/processor is a fair relation, and fullfilled by the Ryzen 9 shown above, but not with the Ryzen 9 3950X 32 logicals w/ "only" 64GB shown initially by gkunz.
Projecting with a 16 core (and thus ideally 32 logicals) processor for my next number cruncher, I would go for 128GB at least ;-)
But enough of tales at this point...

What I missed in the discussion up to now: did you ever inspect the console log for messages, indicating the reason or giving a clue why reduce CPU happens ?

Kind regards
Martin
 
really only Juan can analyze this problem of low CPU usage. based on the anecdotal evidence it really does seem like there is a memory problem when ImageIntegration is run from WBPP. we know the JS engine uses automatic memory management and there have been issues in the past with the JS engine not garbage collecting often enough or aggressively enough. i'm just suggesting this as a possible cause, as nothing much else makes sense at this point.

umh, sorry... as I observed myself, PI is keen in looking and taking into account how much virtual memory is already used.

i'm not following - first, PI's console message says "available physical memory" (not virtual), and secondly the stack size and buffer size are computed to be exactly the same size (give or take) whether ImageIntegration is called from WBPP or if it is run by the user, per @Kvastronomer 's screenshots. per @Kvastronomer 's task manger sceenshots s/he has 64GB of memory which is certainly large-ish by today's standards. and clearly PI is capable of 100% CPU utilization on this task when run standalone... so total memory doesn't seem to be the bottleneck here.

rob
 
Hi rob,

my memory was wrong, you are right: "available physical memory" is reported, as even my screen shots show.
Screenshot_20211209_234622.png


The second console log shows, that the estimated per-thread memory allocation leads to a memory-limited reduction of worker threads to only 5:

Screenshot_20211210_001904.png

*
That's what I meant when referring to memory limited threads, and thus CPU usage.
Again: the console log should be investigated.

Kind regards
Martin
 
I have found today that the same behavior occurred while using ImageIntegration outside of WBPP, this is the first time I've seen that happen, so it's much less common, but it is possible.
 
Similar situation...
Windows 10, Ryzen 9 5900x, 64GB RAM, 1586 images (5544x3684 pixel) = 7% CPU / minimal disk usage using plain Image Integration. CPU isn't even clocking up to it's single core speed of 4.8 GHz and RAM utilization is even lower than if I only integrate 500 or so images.
1646159404231.png

(image files are on e:, OS, program, RAM paging is on c:

I'd share a screen shot of PI while this is happening, but it's non responsive and all the grab gets is the Image Integration window.
 
Back
Top