cannot reproduce Image integration efficiency with huge stacks

gkunz

New member
Hi

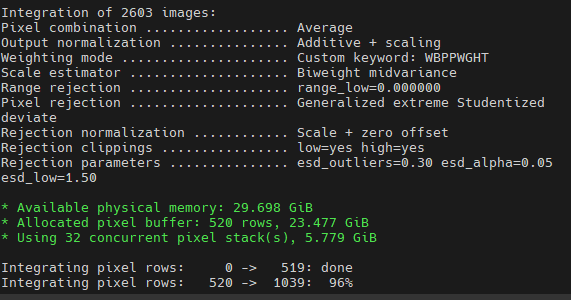
Since I have been starting to do more short exposures (10 seconds) with higher gain in order to battle shotnoise in light-polluted areas, I'm experiencing some real performance bottlenecks in image integration.

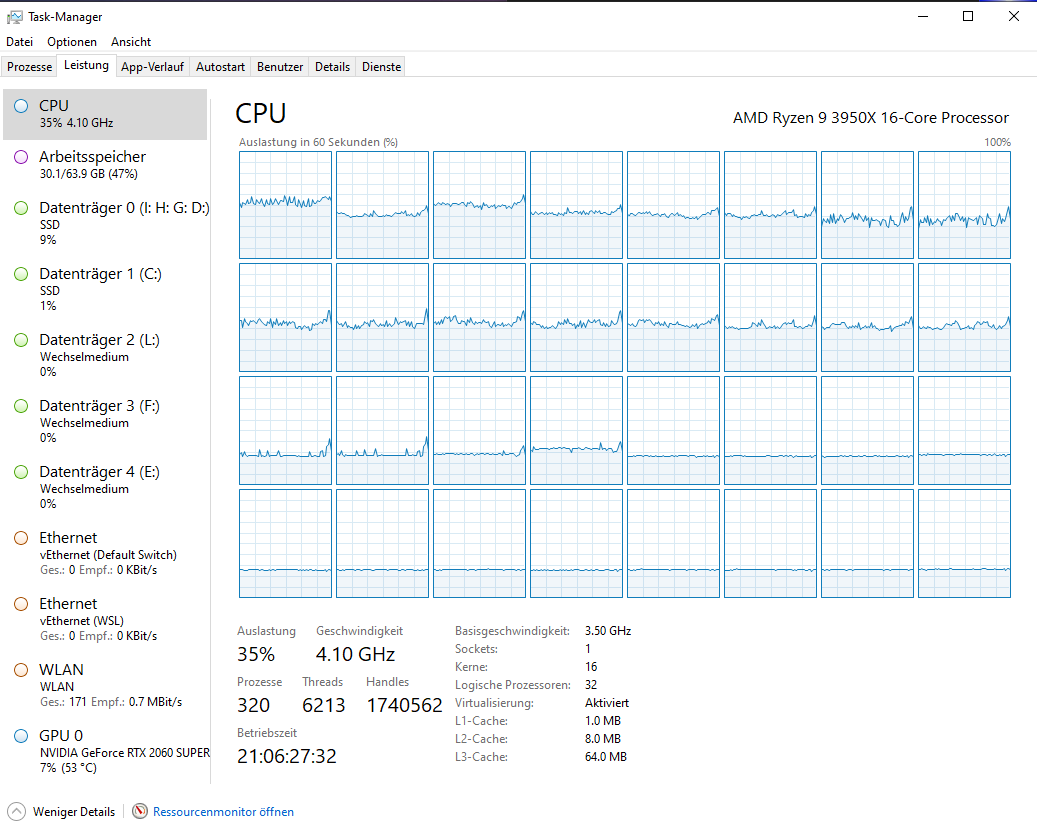
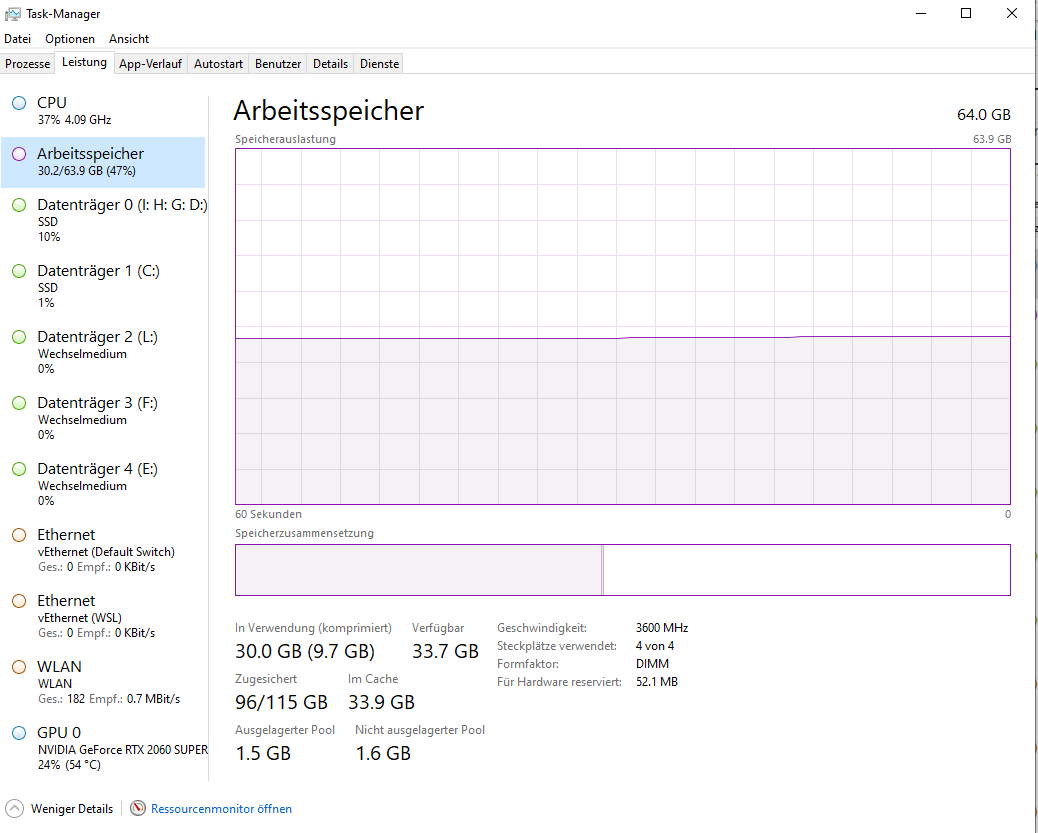
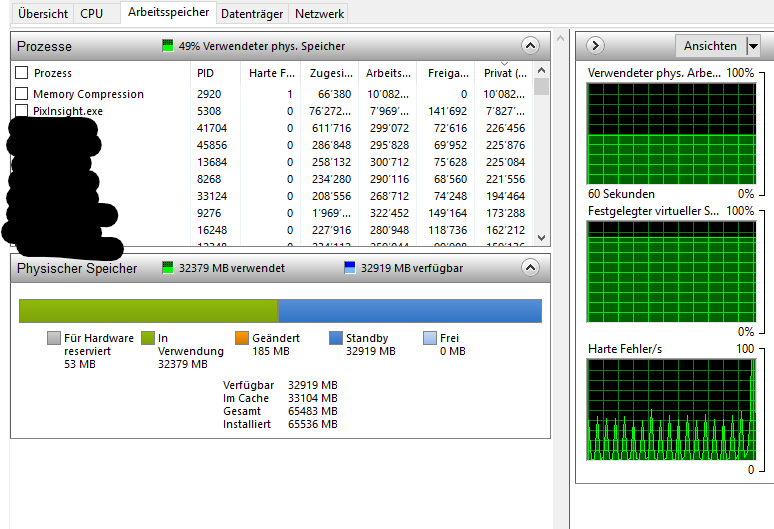
I'm running stacks with 2000+ files which then run for 24h+. I'm running PixInsight Core 1.8.8-8 Ripley on Windows 10. I have an AMD Ryzen 9 3950X with 16 cores running at 4.1 - 4.2 GHz. I have 64GB of ram at 1800 MHz in Dual mode. CPU usage is only at 25% - 35% and more RAM is also available. Also, my storage is not near any significant usage during image integration.

In the image integration, I'm using ESD as a rejection algorithm.

Obviously, there seems to be an efficiency problem with the algorithm. What I don't understand is that the available resources are not really used, not even half of them. If the algorithm was crunching numbers like crazy, shouldn't then at least the CPU be fully used? What could be the bottleneck? I also saw that my pagefile is quite large on my SSD with 50GB. Could it be that memory management is so bad that the page file is preferred for a lot of the memory from the integration process? There seem to be some page faults, but actually not too many. Just a few 30% spikes here and there periodically.
1633977636801.png

1633977661381.png

1633978598730.png

1633977999663.png
 
Hi,
I'm not doing quite the same, but I recently observed crazy long image integration times. My system is also not fully utilized (Ryzen 9 3900X, 64GB Ram, NVMe SSD). The slow integration strongly depends on the rejection algorithm. I tested this with a small stack of 14 images (4256*2848 pixe, Sony A7s). Below is the time it takes for different rejection methods (everything on default settings):

still fast
no rej: 12s
minmax: 15s
percentile: 15s
sigmaclipping: 15s

recently very slow
winsorizedsigmaclipping 3min
linfitclip 22min
gESD 8min


for the slow methods the percentage for "integrating pixel rows" quickly goes to 60% and then very slowly continues to 100%. I'm not really sure when it started (maybe after updating the latest PI Version.

Anybody else experiencing similar behavior?

Cheers,
André
 
recently very slow
winsorizedsigmaclipping 3min
linfitclip 22min
gESD 8min

We cannot reproduce this weird behavior on any platform. However, tomorrow I'll perform stress tests with synthetic data sets of 1000+ images to see if I can discover the cause of these problems, or at least try to reproduce them on some of our machines. I'll let you know what I find.
 
We cannot reproduce this weird behavior on any platform. However, tomorrow I'll perform stress tests with synthetic data sets of 1000+ images to see if I can discover the cause of these problems, or at least try to reproduce them on some of our machines. I'll let you know what I find.
Thanks for the help Juan! I have the same issue with drizzle integration - extremely slow. Just canceled DI of 30 subs after 2h. Switched to my Laptop (15W TDP) and it got it done in 10min on battery. Both machines run the latest version of PixInsight.
 
in general i wonder about high thread-count machines and (hardware) cache efficiency. i actually saw quite a slowdown when i went from an 6C/12T machine to a 16C/32T machine (intel.) the problem is most noticeable on tensorflow, however, i did recompile starnet to use fewer threads and didn't really see a huge change in performance so it could be a machine-specific problem.

rob
 
If it is machine specific it had to be introduced with a recent update of any kind. I'm only facing these issues for a few weeks maybe. Before these processes were running silky smooth on my 12C24T AMD machine.
 
I don't want to jump up and down too early, but I think I fixed it. Really everything I did was delete some old swap files that were still in one of the folders (guess they stayed after a PI crash a few weeks ago). I just integrated 145 subs with gESD and it took less than 5min. CPU was fully used again. Compared to before (same 30 subs) integration is around 10 times faster. Gonna test this further (drizzle next).

I guess there are reasons why swap folders are not purged after a crash but maybe it something I would turn on if optional.

Cheers
André
 
Last edited:
I have somewhat similar performance issues too. I have a 32C/64T CPU. Incidentally, I started catching these problems soon, during the first real extensive editing session after upgrading from an old trusty quad-core CPU where I didn't see anything like that. That was quite a disappointment :)

The CPU was virtually free all the time, with some background tasks eating far less than a quarter of all the threads. Random operations took much longer than they should. Not consistently. Once I start an ImageIntegration and it zips through the stack eating ~40 threads. I click it again immediately and it crawls using only one thread. Some operations, when slowed down, consume even less than a thread at times, around 15%.

NSG script is affected too, especially when it is doing its Normalization step for each image. Normally done in a blink, it may be slowed down to ~10s each.

Especially painful is STF adjustment UI. Each slider movement results in a 3s hiccup!

The immediate cause of this was one background task that runs with high priority and consumes less than 3 threads. That is only 5% of total CPU power! But when that task sleeps, PI is super fast. That finally led me to the 'Enable thread CPU affinity' option in the 'Parallel Processing and Threads' tab of Global Preferences. Disable it and the problem is gone! I guess, I may lose a bit of performance comparing to the ideal scenario when PI is the highest priority task.

It seems, the PI's scheduler is confused when some CPU threads are prioritized to other processes. If that is intentional, then I would say that option should be left disabled by default.

Edit: To clarify the above mentioned, the background task is another independent process, unrelated to PI. PI runs with default priority, while that other task runs with real-time priority. So when it wants CPU it gets it. But it is strictly pinned to and bound by 48 of total 64 CPU threads. During tests, it hovered at 300% CPU usage, give or take. So there is no chance of starvation of PI. By scheduler I mean PI's internal logic that distributes the work across threads, not the OS task scheduler.
 
Last edited:
ok - i'm on OSX and given the underpinnings maybe i should try turning off the thread affinity too. i figured the thread affinity thing was more about cache pollution/thrashing and didn't really think about the sensitivity to or interference with the scheduler. i'm away from my desktop machine for a while so i can't test this immediately.
 
well according to the tooltip, the thread affinity control does not do anything on OSX, so i guess that's not the problem for me.
 
The behavior that you are describing cannot be reproduced under normal working conditions. There is no performance degradation caused by the thread affinity control feature in all of our working and testing machines running a variety of Linux distributions, mainly Kubuntu 20.04 LTS.

Anyway, preferences settings exist precisely to provide enough flexibility to adapt our software to different use cases and scenarios. The default settings are tested to be acceptable in general, but not guaranteed to work optimally in any particular case. If I understand your post well you have discovered that by disabling thread affinity control you can solve the machine-specific performance issues that you were experiencing.
 
I can confirm same behavior as topic starter described. AMD Ryzen 9 5900HX stays at 30% during integration of 1200 frames. It took 6 hours to integrate just one out of 3 channels. This PC scores 21000 at PI benchmark and used to process hundreds of frames much faster before. Something did change recently.

1638424580607.png
 
I can confirm same behavior as topic starter described. AMD Ryzen 9 5900HX stays at 30% during integration of 1200 frames. It took 6 hours to integrate just one out of 3 channels. This PC scores 21000 at PI benchmark and used to process hundreds of frames much faster before. Something did change recently.

View attachment 12793
It sounds exactly like what I experienced and described above. All I did to fix it was deleting old swap files (that stayed after a crash) in all the swap folders. This resolved all issues
 
while that is good housekeeping it shouldn't really do anything to PI performance. the swap files are where PI keeps the undo history of every view that's open on the desktop. if PI crashes the swap files are not deleted. when PI starts up again, as far as i know, the leftover swap files are simply ignored. further, i don't think ImageIntegration has any need to read or write any file in the swap directory, old or not. so in theory cleaning up the swap directory shouldn't change PI performance.

as for @Kvastronomer's problem - are you using the ESD rejection method? the other thing is that the II process could become memory-bound and this can limit the cpu utilization.

In my previous message I posted screenshot of integration performance issue when processing 1200 frames. I ran it using WBPP with default parameters, so rejection method was "Auto". Entire WBPP process took 16 hours, 1 hour for (calibration/cosmetization/debayering/registration) and remaining 15 hours for integration.
Once that WBPP run was completed, I delete PI swap files and restarted PC. Then I loaded WBPP with new batch of 1230 files and it is running now as shown on the screenshot below. Reccomendation from @Dre_bo did help!!!!!!!!!!!!!!!!!!!
Now, can PI team automate swap files cleanup on PI start?

1638472171240.png
 
while that is good housekeeping it shouldn't really do anything to PI performance. the swap files are where PI keeps the undo history of every view that's open on the desktop. if PI crashes the swap files are not deleted. when PI starts up again, as far as i know, the leftover swap files are simply ignored. further, i don't think ImageIntegration has any need to read or write any file in the swap directory, old or not. so in theory cleaning up the swap directory shouldn't change PI performance.

as for @Kvastronomer's problem - are you using the ESD rejection method? the other thing is that the II process could become memory-bound and this can limit the cpu utilization.

One more comment for @pfile
You mentioned that integration does not need to read/write files but I see 30% and even 50% usage spikes on system disk. Of course it could be windows swapping.
 
@Kvastronomer no, i didn't say ImageIntegration did not need to read/write files... it obviously does that a lot. any process run in the global context reads and writes files from disk. ImageIntegration does not need to read or write pixinsight swap files.

obviously there can be a lot of swap files hanging around if you have had multiple crashes. and the read/write performance in the swap directory could go to hell if the directory inodes become huge. but since ImageIntegration isn't messing around in that directory it's hard to see how it could have any effect.

you also rebooted your computer and so the test was not exactly scientific with respect to the leftover swap files being the cause of the problem. i'll leave it to @Juan Conejero to comment on how a full swap directory could affect ImageIntegration, but to my knowledge there is no connection between the two.

rob
Thanks @pfile for quick response. I agree that reboot ruined the test. Just want to mention that this PC is only for PI processing. It has nothing else installed on it. Clean Win 10 and PI.
 
Back
Top