The new sorting is a great time saver. Thanks.
")
Can you advise if you have done some comparisons of resulting image quality with NWeight vs other image integration options?
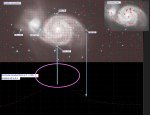
Other than improved gradient, which is a huge improvement, I am having trouble to see, or to measure my integrated images to determine which is best for post processing. The attached file has the descriptions of the integrations and quantitative results.
I am surprised the NSG script (Ver 1.3) does not provide a clear winner for my light polluted data.
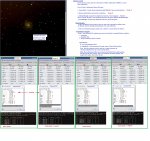
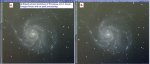
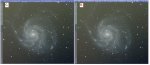
Attached are the measurements I did with PI processes & scripts of 4 different integrations of the same calibrated, cosmetically corrected, debayered and registered. I used Statistics, DynamicPSF, and Noise Evaluation - CFA Bayer.
If you, or someone else has any comments on this data and the screen shots of the 4 images I would appreciate it.
As you demonstrate here, there are many ways of calculating image weights. Each method's accuracy will depend on different things. Methods can vary from being highly consistent, getting a good answer all the time, to only occasionally doing well, and anything in between. In your test data set, it appears that all the methods you used produced equally good results. If you cannot see the difference in the stacked result, the difference is not significant.
Personally, I would be cautious about reading too much into the noise statistics you have produced. Accurately calculating image noise is a very tricky problem. I think PixInsight's noiseMRS method does a great job, but it will not be perfectly accurate.
I am confident that noiseMRS accuracy is better than 1 part in 2, but is it accurate to 1 part in 10? Or 1 part in 100 (2 decimal places)? Some testing I did may indicate that the calculated noise has a small dependency on the image's gradient. If this is true, it would mean that if two images had different gradients, small differences in the noise result could be either down to the actual difference in noise, or due to differences in the gradient.
Before noiseMRS results can be compared, they need to be scaled. This is also true for most of the other statistics you are looking at. At the very least, you should use NSG to normalize your 4 stacks before comparing the statistics.
Even if you normalize the stacked images, the noise values may still be misleading. A stacked image is created from registered images. Each registered image has been shifted to a fraction of a pixel. This introduces a smoothing effect, which varies depending on the size of the fraction. A integral shift (zero fraction) produces no smoothing. A shift of 0.5 pixels will have a large smoothing effect. If a high weight is assigned to a smoothed image, the final noise in the stacked image will look less - it is the same as applying a bit of smoothing to the final stacked image. This does not make the stacked image better, but it will fool the noise estimate.
Note that you can use the noise estimate of the stacked image to provide a guide on how effective ImageIntegration's data rejection was because this does not change the image weights, or the registration smoothing, so the relative results are still valid.
I have not used the scaled noise evaluation script, but I would have thought that the Bayer CFA Version is not the right version for an image that has already been debayered.
Here is my personal run down of some of the methods used to calculate weights:
Number of stars
The number of detected stars will depend on the signal to noise ratio, but it also depends on:
- how steady the atmosphere is
- how good the guiding is
- focus drift.
If all three of these dependencies remain constant for all images, the number of stars will correlate to the signal to noise ratio. This is more likely to be the case for under sampled images where stars are typically smaller than a pixel.
I would use this method if I was imaging a star cluster, because it will favor the images with the sharpest stars. However, it will not help bring out the detail in faint nebula. For faint objects, it's shot noise that determines the level of detail (see
https://en.wikipedia.org/wiki/Shot_noise).
ImageIntegration Noise evaluation
This calculates the weights from the scaled noise estimate. The noise was calculated from the images before registration or debayer interpolation, which improves the accuracy. The noise is calculated by using noiseMRS, and it is stored in the FITS header (NOISExx).
ImageIntegration has an algorithm that determines the scale factor for each image. The accuracy of the scale factor algorithm is critical, because the final weight depends on the square of the scale.
NormalizeScaleGradient
This also uses the noise estimates stored in the NOISExx FITS headers.
The only significant difference between NSG and ImageIntegration's noise evaluation, is the way the scale factors are calculated. NSG uses stellar photometry. The accuracy of the scale factor is critical, because the final weight depends on the square of the scale.
After NSG has completed, it displays ImageIntegration. You can change the method used to determine the weights. You should also check that the data rejection settings are what you want.