
Starting from PixInsight Core version 1.8.0, the gnuplot graphing utility is part of standard PixInsight Core distribution on all platforms. This means that you can execute gnuplot from a PixInsight JavaScript script or PCL/C++ module to generate custom graphics.
The version of gnuplot included with PixInsight has two main limitations. One of them is that the application has basically no user interaction capabilities. It does not have a graphical user interface, and has only limited console I/O functionality. In other words, the gnuplot program that we have in PixInsight is not intended to be accessible to the user, but to scripts and modules that use it as their graphics generation back-end.
The other limitation is that, due to dependencies on some third-party libraries, the only output format available on all platforms is Scalable Vector Graphics (SVG). PNG output is only available on X11 platforms (Linux and FreeBSD). Note that, in practice, this is not an actual limitation, since SVG is in fact the best format available for graphics generation.
Using gnuplot from a PixInsight script or module cannot be easier. These are the basic steps:
1. Write a gnuplot script, which is a plain text file. In the script, you must specify the SVG output format and the path to an output file.
2. If necessary, write a data file in a format that gnuplot can read and use.
3. Execute the gnuplot application as an external process.
4. Optionally, communicate with the gnuplot process by reading its standard output channel.
5. Load the generated SVG file and render it as a bitmap in PixInsight. The bitmap can be combined with other bitmaps or images, and can be shown on a control or as a new image window.
Let's put a little example. Along with gnuplot's reference documentation, gnuplot's website provides a large number of examples and demo scripts that one can use for testing and learning purposes. I have taken one of these demo scripts, namely a 3D representation of a Mandelbrot function, to build a step-by-step example.
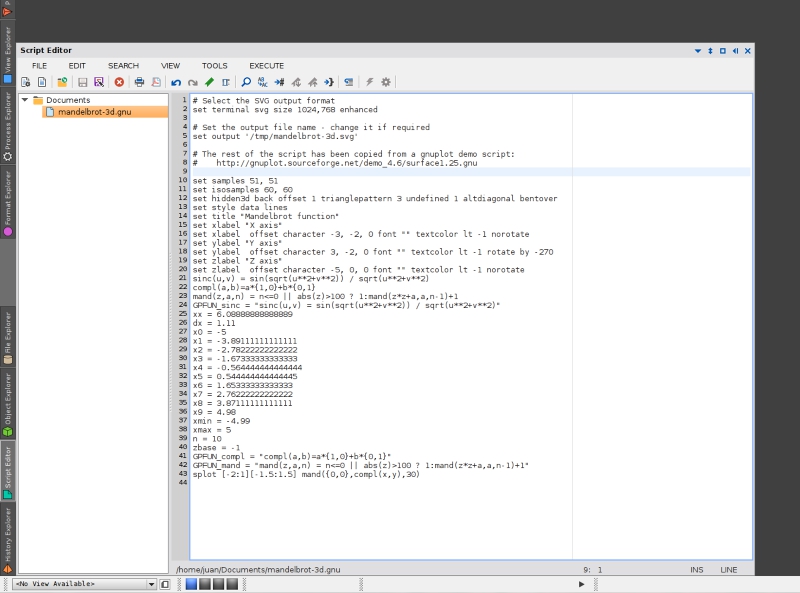
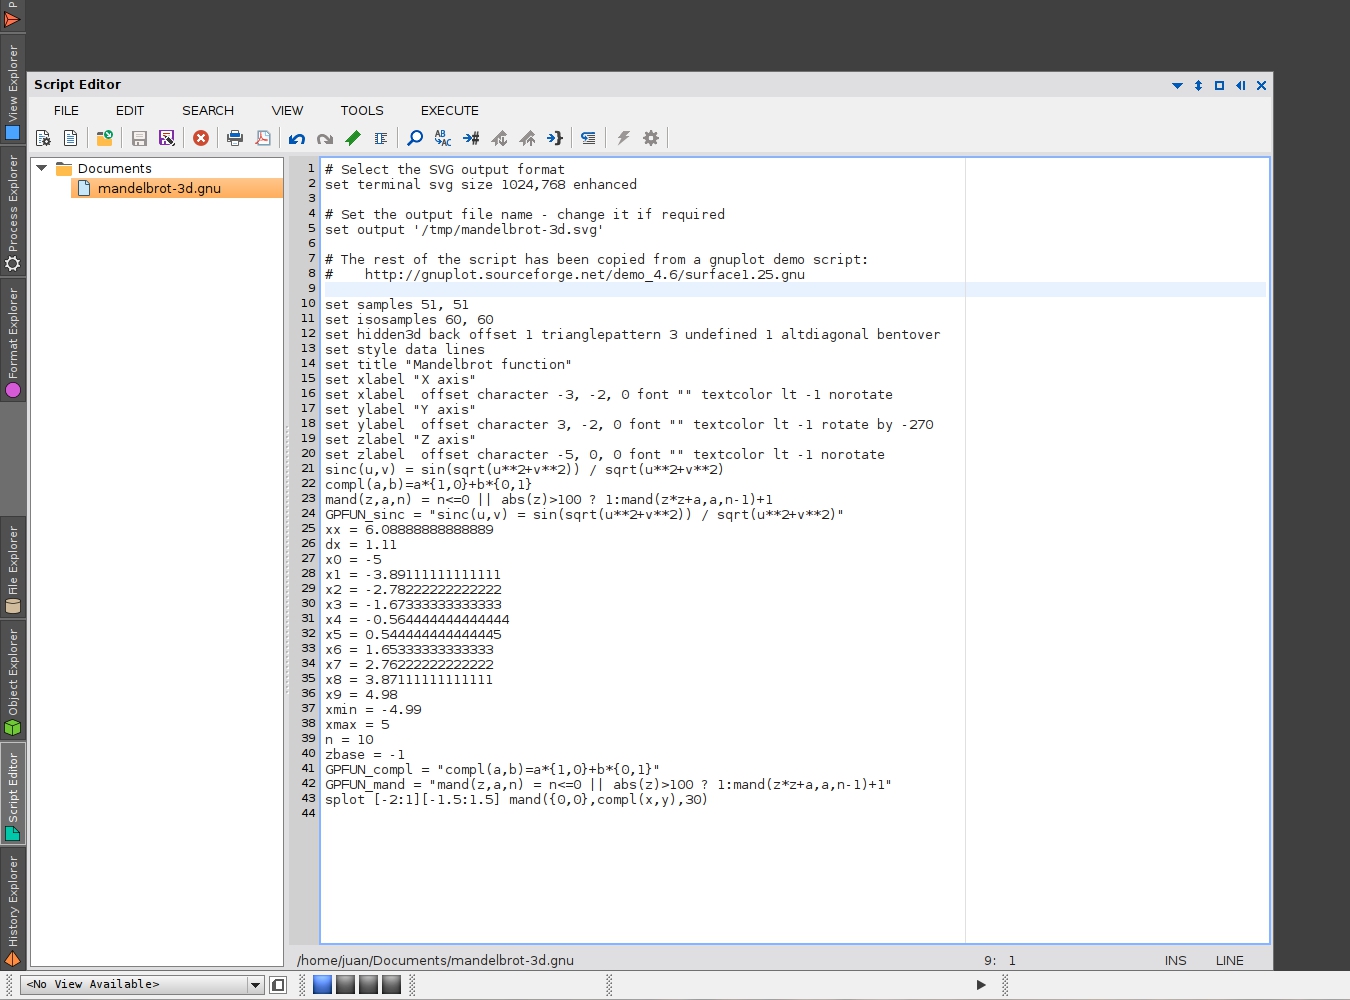
This is the gnuplot script for this example:
Copy this script and paste it in a new Script Editor document. Then save it as 'mandelbrot-3d.gnu' on a directory of your choice. In my case, I have saved it to the Documents directory under my home directory (I use Linux), so the file path is: '$HOME/Documents/mandelbrot-3d.gnu'.
Now let's test the script by running gnuplot. From the Process Console command line, enter the following on Linux and Mac OS X:
where you should replace '$HOME/Documents/mandelbrot-3d.gnuplot' with the actual file path where you have saved the script on your machine. On Windows, let's assume you've saved the script to a Documents folder under your user profile folder:
The two bangs (!!) in front of the command execute the gnuplot program as an independent process (a daemon on UNIX/Linux). With a single bang, gnuplot would be executed as a child process. Note that this can cause problems because the version of gnuplot included with PixInsight cannot interact with PixInsight's console, so if the script does not work, running gnuplot as a child process may lead to a crash. The PXI_BINDIR environment variable is always defined by the PixInsight Core application as its default binary installation directory, i.e. the directory where the PixInsight executable resides.
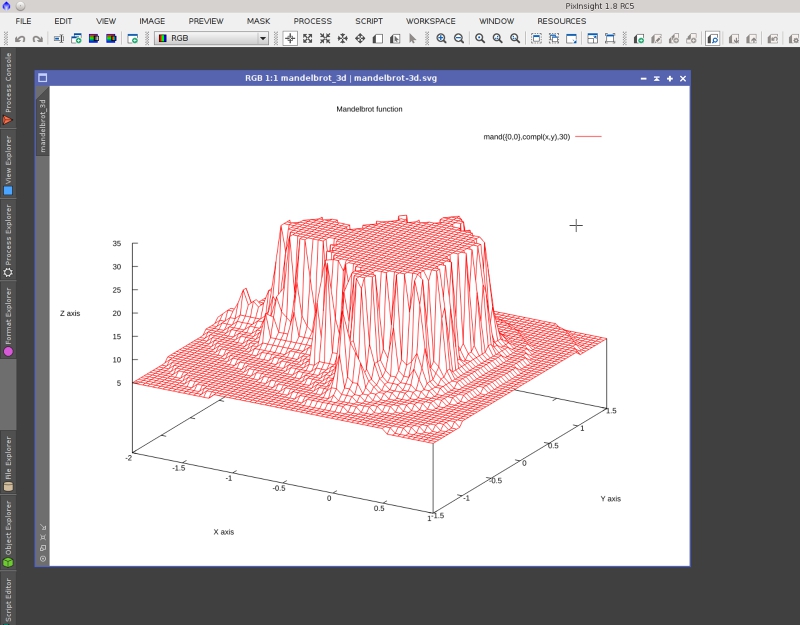
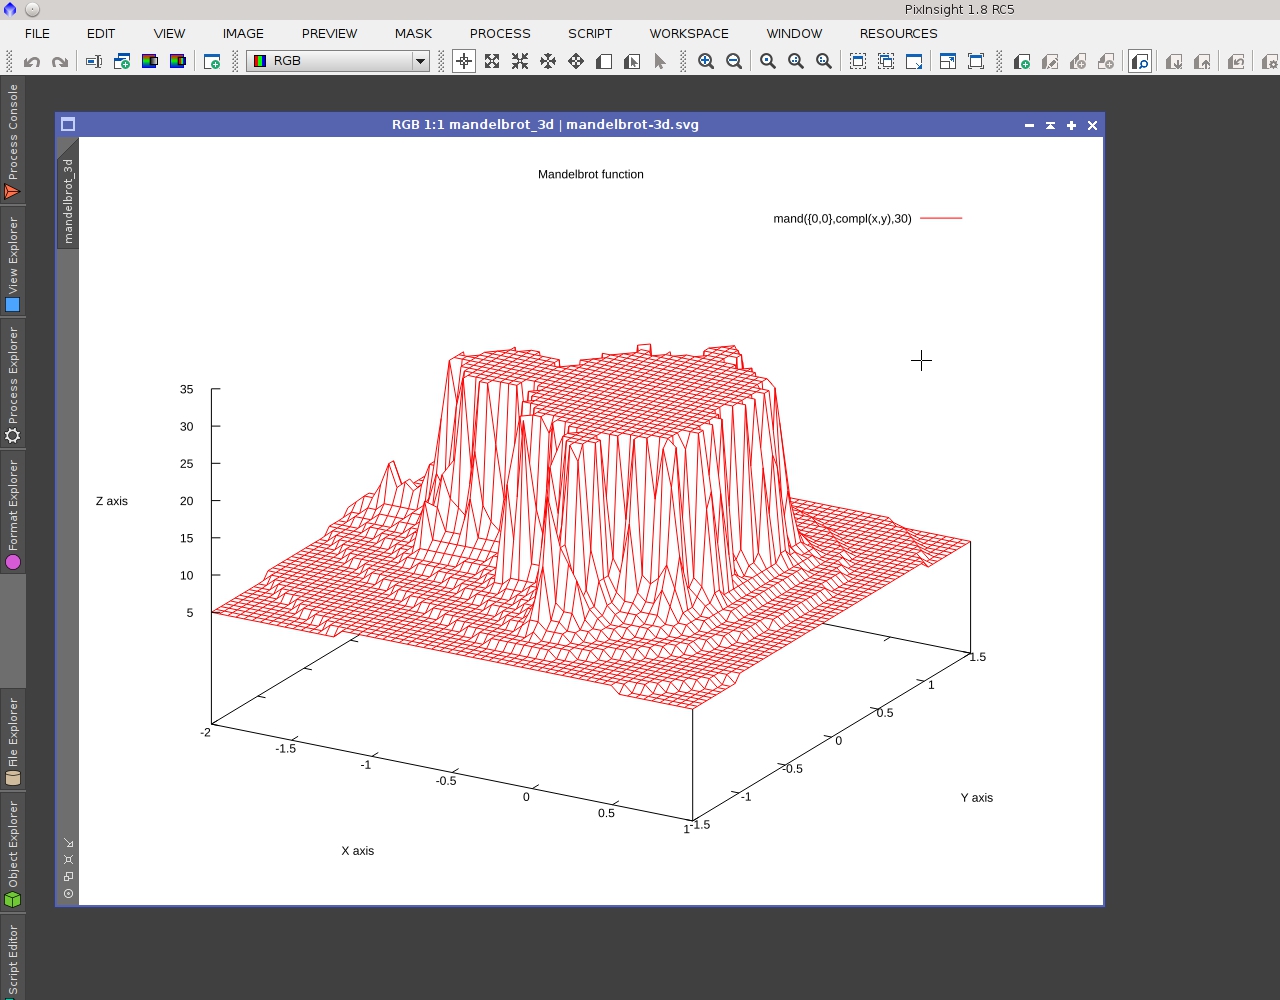
Now if everything went well, gnuplot has generated an SVG file at the location specified by the 'set output' command in the script. We can open it as a new image in PixInsight:
To execute gnuplot from PCL/C++ code, you should use the ExternalProcess class. In a similar way, you should use the ExternalProcess core JavaScript object from a PJSR/JavaScript script.
I hope this new feature will help all PixInsight developers to create better and more powerful tools. A big thanks to the gnuplot authors for releasing their wonderful work under a truly open-source license, which has allowed us to integrate it with PixInsight.
The version of gnuplot included with PixInsight has two main limitations. One of them is that the application has basically no user interaction capabilities. It does not have a graphical user interface, and has only limited console I/O functionality. In other words, the gnuplot program that we have in PixInsight is not intended to be accessible to the user, but to scripts and modules that use it as their graphics generation back-end.
The other limitation is that, due to dependencies on some third-party libraries, the only output format available on all platforms is Scalable Vector Graphics (SVG). PNG output is only available on X11 platforms (Linux and FreeBSD). Note that, in practice, this is not an actual limitation, since SVG is in fact the best format available for graphics generation.
Using gnuplot from a PixInsight script or module cannot be easier. These are the basic steps:
1. Write a gnuplot script, which is a plain text file. In the script, you must specify the SVG output format and the path to an output file.
2. If necessary, write a data file in a format that gnuplot can read and use.
3. Execute the gnuplot application as an external process.
4. Optionally, communicate with the gnuplot process by reading its standard output channel.
5. Load the generated SVG file and render it as a bitmap in PixInsight. The bitmap can be combined with other bitmaps or images, and can be shown on a control or as a new image window.
Let's put a little example. Along with gnuplot's reference documentation, gnuplot's website provides a large number of examples and demo scripts that one can use for testing and learning purposes. I have taken one of these demo scripts, namely a 3D representation of a Mandelbrot function, to build a step-by-step example.
This is the gnuplot script for this example:
Code:
# Select the SVG output format
set terminal svg size 1024,768 enhanced

# Set the output file name - change it if required
set output '/tmp/mandelbrot-3d.svg'

# The rest of the script has been copied from a gnuplot demo script:
#    http://gnuplot.sourceforge.net/demo_4.6/surface1.25.gnu

set samples 51, 51
set isosamples 60, 60
set hidden3d back offset 1 trianglepattern 3 undefined 1 altdiagonal bentover
set style data lines
set title "Mandelbrot function"
set xlabel "X axis"
set xlabel  offset character -3, -2, 0 font "" textcolor lt -1 norotate
set ylabel "Y axis"
set ylabel  offset character 3, -2, 0 font "" textcolor lt -1 rotate by -270
set zlabel "Z axis"
set zlabel  offset character -5, 0, 0 font "" textcolor lt -1 norotate
sinc(u,v) = sin(sqrt(u**2+v**2)) / sqrt(u**2+v**2)
compl(a,b)=a*{1,0}+b*{0,1}
mand(z,a,n) = n<=0 || abs(z)>100 ? 1:mand(z*z+a,a,n-1)+1
GPFUN_sinc = "sinc(u,v) = sin(sqrt(u**2+v**2)) / sqrt(u**2+v**2)"
xx = 6.08888888888889
dx = 1.11
x0 = -5
x1 = -3.89111111111111
x2 = -2.78222222222222
x3 = -1.67333333333333
x4 = -0.564444444444444
x5 = 0.544444444444445
x6 = 1.65333333333333
x7 = 2.76222222222222
x8 = 3.87111111111111
x9 = 4.98
xmin = -4.99
xmax = 5
n = 10
zbase = -1
GPFUN_compl = "compl(a,b)=a*{1,0}+b*{0,1}"
GPFUN_mand = "mand(z,a,n) = n<=0 || abs(z)>100 ? 1:mand(z*z+a,a,n-1)+1"
splot [-2:1][-1.5:1.5] mand({0,0},compl(x,y),30)
Copy this script and paste it in a new Script Editor document. Then save it as 'mandelbrot-3d.gnu' on a directory of your choice. In my case, I have saved it to the Documents directory under my home directory (I use Linux), so the file path is: '$HOME/Documents/mandelbrot-3d.gnu'.
Now let's test the script by running gnuplot. From the Process Console command line, enter the following on Linux and Mac OS X:
Code:
!!$PXI_BINDIR/gnuplot $HOME/Documents/mandelbrot-3d.gnuwhere you should replace '$HOME/Documents/mandelbrot-3d.gnuplot' with the actual file path where you have saved the script on your machine. On Windows, let's assume you've saved the script to a Documents folder under your user profile folder:
Code:
!!"$PXI_BINDIR/gnuplot.exe" $USERPROFILE/Documents/mandelbrot-3d.gnuThe two bangs (!!) in front of the command execute the gnuplot program as an independent process (a daemon on UNIX/Linux). With a single bang, gnuplot would be executed as a child process. Note that this can cause problems because the version of gnuplot included with PixInsight cannot interact with PixInsight's console, so if the script does not work, running gnuplot as a child process may lead to a crash. The PXI_BINDIR environment variable is always defined by the PixInsight Core application as its default binary installation directory, i.e. the directory where the PixInsight executable resides.
Now if everything went well, gnuplot has generated an SVG file at the location specified by the 'set output' command in the script. We can open it as a new image in PixInsight:
To execute gnuplot from PCL/C++ code, you should use the ExternalProcess class. In a similar way, you should use the ExternalProcess core JavaScript object from a PJSR/JavaScript script.
I hope this new feature will help all PixInsight developers to create better and more powerful tools. A big thanks to the gnuplot authors for releasing their wonderful work under a truly open-source license, which has allowed us to integrate it with PixInsight.