Blending Ha with Red...a new approach

aworonow

Well-known member
All,
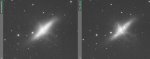
  The "correct" way to blend a narrowband image, particular an H-alpha image, with its corresponding broadband image, in this case a Red image, has had many comments, questions, and even implementations. I've taken a physical approach to the problem. The narrowband and broadband images both represent mixtures of a background (red) signal and an emission-line (Ha) signal. As such the two images provide a pair of simultaneous equations that allows us separately to estimate their two signal components for each pixel. Then, of course we can remix the red background with the Ha line emission in any proportions we desire to produce an image that can be used wherever the red image would be used, but having enhanced Ha signal.
  That is what my icon BLM does (at the dropbox link below). The derivation of the equations (simple) and an example are also in the dropbox file. Hope they are of use. But this is the first incarnation of the algorithm, so use with care.

https://www.dropbox.com/s/1fv6b7wcsdlld0e/BLM.zip?dl=0

Alex Woronow
 
Hi Alex,

Well - that is certainly a new and interesting approach (new to me, anyway). Personally, I cannot argue either for or against your approach, as I do not image in narrow-band at all. However, you have clearly thought long and hard, and have taken the time to carefully (and clearly) explain your new paradigm.

It will be interesting to see how others view this approach - especially PTeam members such as Vicent and Juan.

Maybe we have a new process in the making: "Woronow Narrowband Blending" ?  :D

Certainly, it is great to see PixInsight processes being leveraged to try and solve issues that have never been fully explored. Well done!
 
The assumptions inside those provided scripts largely remain undocumented, although some claim a connection to an article by Vicent Peris (probably this link? https://pixinsight.com/tutorials/narrowband/). That pedigree often seems dubious, given a quick look at scripts? code.

this has been bugging me.

i looked back thru the forum and found this thread:

https://pixinsight.com/forum/index.php?topic=3401.0

you will see references to "Vicent's Method" there and and in the middle of that thread is a script by Silvercup which apparently implements what was known at the time as "Vicent's Method". bear in mind we're talking about 2011 here.

the script NBRGBCombination was written by Ioannis, and the opening comments of the script point to this thread: http://pixinsight.com/forum/index.php?topic=3446.0

in that thread someone raises your objection - that the script does not represent's vicent's method as described in the webpage in your quote.

so my mistake for previously pointing to the webpage in your quote, but my point is that Harry and others had been referring to what both scripts do as "Vicent's Method." it's apparently something different than what vicent has presented on that webpage.

interestingly, in one of those threads, Vicent disavowed the idea of a "Vicent's method" because every image is different and may require different Ha blending methods. nevertheless, the pixelmath underlying the scripts and Harry's XPSMs are apparently due to Vicent.

anyway i look forward to trying your new method.

rob
 
Thanks for the input and interest. Rob, yeah, I read most of that background stuff too and it really seems to have gotten muddled over time. I did not go into all that in the write-up I did. Someone I asked to read it before posting thought (correctly so) that confused things and was too critical. So I dropped it.

On a cheerier note, in the wee hours of the morning the thoughts arose...I could use the separated background and emission line to reconstruct an estimate of what a 3nm Ha filter would see...or a 10nm filter...or any other. Then, I thought, what if I could use the L and R to estimate what some Ha filter would observe. I tried it and here's the skinny (attached with the reconstructed Ha on the left and the observed Ha on the right). Not bad! Maybe buying an Ha filter is not all that important? So I tried to get the emission line from the L and R. I guess it was a stretch too far, the results were so-so at best. (BTW, both attempts were through 'reverse engineering'.) Maybe a better, more complete model of the background sources and filter shapes would yield better results? maybe.

Thanks again, Alex Woronow
 

Attachments

  • reconstructed Ha.jpg
    reconstructed Ha.jpg
    36.1 KB · Views: 147
Glad to see someone is taking another crack at this.  I often find the scripts don't give me the best results.  :'(
Vicent's method manually can be quite tricky too.

 
I get two icon for pixel math. They appear in a fifth workspace which had me confused O:)

Max
 
Hi,

Please take a look at this thread:

https://pixinsight.com/forum/index.php?topic=2036.msg13145#msg13145

I've been using the continuum subtraction method from 7 years ago. The continuum subtraction is not really my own idea since it has been widely used in professional astronomy from long time ago; what's mine is the idea of adding the continuum-cleaned H-alpha image to the color image. People coming to my intensive workshops since 2013 have a full example on this technique as part of the documentation. Some of my images have been developed using this technique:

https://pixinsight.com/forum/index.php?topic=10353
https://pixinsight.com/forum/index.php?topic=10351
https://pixinsight.com/forum/index.php?topic=10352
http://astrofoto.es/Galeria/2011/M74/M74_CAHA_en.html
http://astrofoto.es/Galeria/2010/M51/M51_CAHA_HaRGB_en.html
http://astrofoto.es/Galeria/2012/PK164/PK164_CAHA_en.html
http://astrofoto.es/Galeria/2011/M31/M31_CAHA_en.html

To have an optimal result using this technique, you should take care of the below points:

- Always you add or subtract an image from another, don't subtract the sky level to avoid any clipping. That way it's also easier to check the result using STF. For instance, if you subtract the H-alpha image from the red, the equation would be R - Ha + med( Ha ). If you're multiplying the H-alpha image by a factor ("k"), then the equation is: R - ( Ha - med( ha ) ) * k.

- You are going to multiply the H-alpha image by a high number when you add it to the red channel. This also means that you're going to multiply the noise. So you'll always need to denoise the H-alpha image first.

- Even when you denoise the H-alpha image, it's difficult to get rid of the large-scale noise. There's no sense in enhancing the H-alpha image in the areas where you don't have H-alpha emission. So it's better to apply the H-alpha enhancement through a mask (built also from the cleaned H-alpha image) that selects just the H-alpha regions.

Even if there are multiple ways to integrate narrow and broad band images, I am currently teaching two techniques in my workshops. The first one, described here, works well when there's only H-alpha emission and it's applied to linear images. The second one preserves all the color information and it's applied to non-linear images. In the second case, the first technique produces terrible results as the nebulae become completely red with no different hues.


Best regards,
Vicent.
 
I like your method in pixel math.  I not sure what second icon is for  I produced this.

http://www.astrobin.com/full/300617/C/

Will the method only work for Ha?

Thanks

Max
 
Max,
Glad you found it useful. The second icon is not really required. It simply scales the HaR mix back to the same median value as the R aloneoriginally had. Occasionally, this might make the RGB combine process yield a more nearly color-balanced image (assuming that the R was going to work well in the first place).

That's a very nice image. Good, powerful color and shape.

Alex
 
In so far as OIII's main emission is in the blue, it could have the same math applied to it and the B image as done with the Ha and R. Not ideal, but often usable. I just (this morning) did that with a planetary neb with some good results.

(OIII is kind of blue-green, as I read it. But I don't know how to partition the emission. Maybe proportionally to the distance to pure blue versus pure green? Some cipher'n would be required, as Jethro Bodine would say." So I just drop it into the blue for now.)

Alex
 
Upon thought (and a few "goes intos"), if any narrowband line lies entirely within a single broadband filter, the equation for mixing narrowband and broadband are the same as in the derived equation.

Max...are you a member of HAC? I am. But living in Silver City, it's a long trip to meetings and I seldom make it.

Alex
 
aworonow said:
In so far as OIII's main emission is in the blue, it could have the same math applied to it and the B image as done with the Ha and R. Not ideal, but often usable. I just (this morning) did that with a planetary neb with some good results.

(OIII is kind of blue-green, as I read it. But I don't know how to partition the emission. Maybe proportionally to the distance to pure blue versus pure green? Some cipher'n would be required, as Jethro Bodine would say." So I just drop it into the blue for now.)

Alex

If your blending into RGB it is usually an aqua color.

So most people would distribute OIII 50% into the Green then 50% in blue.
 
If you have broad-band filters that do not overlap, then the OIII goes into the color of the filter that covers the wavelength of the OIII emission line (500.7 nm as the primary line). It is being registered by the broad-band filter that covers this wavelength...as the equations assume. If more both the blue and green broad-band filters cover the primary line (and, perhaps the secondary line as well), then the unmixing of intensity sources is not so simple and not really appropriate for the equations I presented. Unfortunately, 500.7 nm lies smack-dab between green and blue for Astrodon true balance filters. I suspect that people add the OIII to the green because the secondary emission of OIII is slightly greener than the primary...but still in the gap. So what you do is dictated by the filters you have and the color effect you want, especially if you decide to try to unmix intensity sources using my equations.

Alex
 
The 501 nm area would have an natural aqua/ cyan color.

Most RGB filters sets intentionally cross the OIII between G and B. When balanced this give aqua/cyan.

You method would have to be changed to apply it 50/50.
 
I fact, if both the blue and the green receive the full blast of OIII emission, then one should assume 100 contribution to each and treat each accordingly.
alex
 
Surely the final outcome depends entirely on what the PixInsight user feels happiest with?

The human eye cannot make all of these colour distinctions in the first place, with our retinae not having been blessed with narrow-band filters. So, whatever final outcome and colour-mix you might choose, in this case you very much get the chance to play the hand of a greater Deity.

Yes, you are perhaps trying to approximate what you believe a 'bionic' eye might perceive, but you have to just go with what you are happiest with.

Perhaps what we need, for narrow-band images, is a Process that  gives us three (or even more?) slider-controls, each of wjich is 'tied' to a narrow-band image that we would like to incorporate into an existing (or new) 3-channel 'colour' image. The sliders, moving left and right, would represent 'where' in the colour spectrum (i.e. at which wavelength, in nm) the images should be placed. Along with each 'centre frequency' that the main slider would control, there could be a second control (or pair of controls) that would define the lower- and upper- 'sidebands' of this centre frequency - i.e. they would convey a bandwidth, or passband, for the narrow-band image that is to be incorporated.

With this Processing Tool, and a real-time preview of the final image being built, the colour mixing could be a very dynamic process. It could even help with the colour blending of RGB images - allowing RGB filter sets to be characterised and correctly mixed (even for OSC cameras).

But, maybe (I don't know) I am just missing some vital point. Has anybody ever tried something along these lines?
 
Back
Top