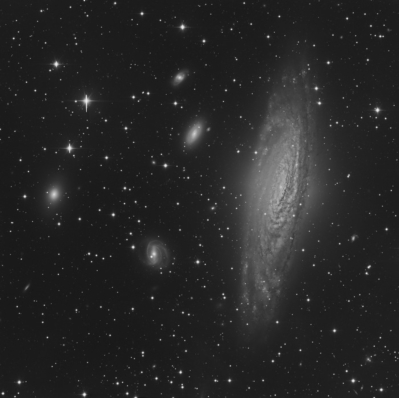
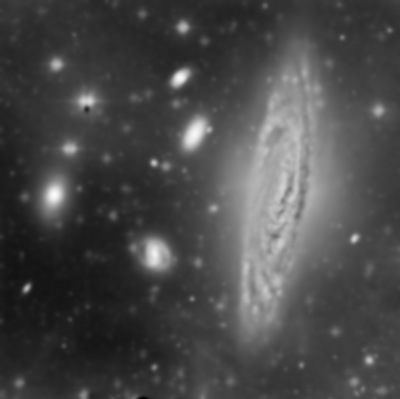
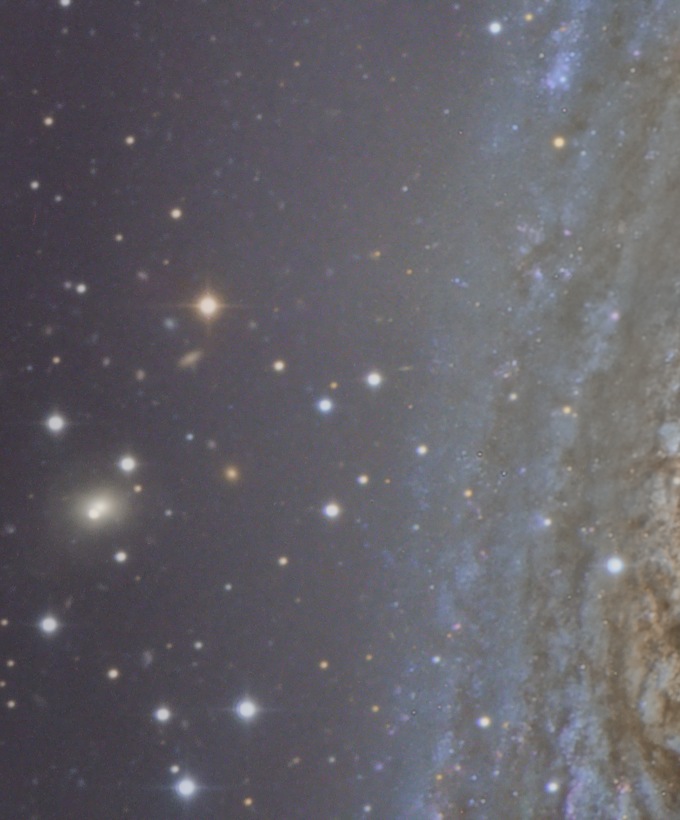
NGC 7331 with Calar Alto 3.5-meter Telescope and the LAICA Camera
By Vicent Peris (OAUV/PTeam)
Data acquired by Gilles Bergond
Introduction
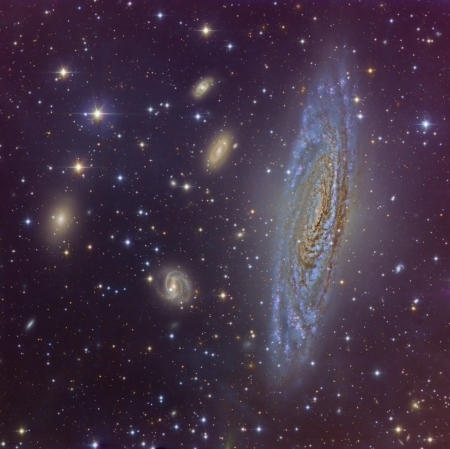 This image of NGC 7331 and its surrounding galaxies is my first astrophotographic work with Calar Alto Observatory (CAHA). First I must thank Joao Alves, the Director of the Observatory, because the data for this work have been acquired during his discretionary observational time. Also thanks to Gilles Bergond, the service astronomer who acquired the data, and to David Galadí-Enríquez, who wrote the image release published at Calar Alto's website. Finally, thanks to Vicent J. Martínez, ex-Director of the Astronomical Observatory of the University of Valencia (OAUV), the institution where I work as a professional astrophotographer.
For me, this image is just a starting point. The work of scientific photographers is important for the public outreach of astronomical research. The CAHA and the OAUV have given a first step; I hope this cooperation will continue from now on as a contribution to the excellent science communication activities performed by both institutions.
Image Caption and Credits: NGC 7331 with the 3.5-meter Zeiss Telescope of Calar Alto Observatory and the LAICA camera, by Vicent Peris (PTeam/OAUV). Entirely processed with PixInsight 1.2. Click on the image to download a full-resolution version.
To know more about the objects present in this image you can read the official image release published at Calar Alto Observatory's website.
This image integrates a total of 139 minutes of exposure time. It is composed of 1-minute and 10-minute exposures that I have combined to create a linear, high dynamic range image. The integration method has been described on PixInsight Forum:
http://pixinsight.com/forum/viewtopic.php?t=422
http://pixinsight.com/forum/viewtopic.php?t=423
Here I'll describe some interesting processing techniques that I have implemented to process this image. Read these paragraphs as a source of inspiration: you won't find a step-by-step manual here. If you don't want to read the whole text, I particularly recommend reading the sections about color and wavelet processing.
In the section about wavelets processing, I describe my current methodology for the non-linear processing stages of all my images. I have developed these techniques during eight years of intense research in aesthetics and image processing.
Image Calibration
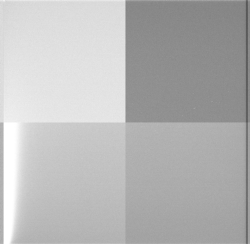
Each LAICA CCD has four readout outputs to achieve a very low read noise and a fast readout time. This poses a problem though: each of the four analog-to-digital converters have a slightly different bias level. On Figure 1 you can see a bias image for CCD #1, stretched to show the count 282 as black and the count 315 as white.
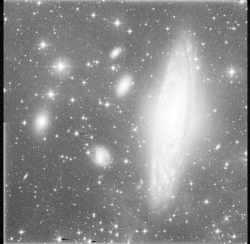
Furthermore, the bias level changes a few counts during each image readout operation (Figure 2). Although this can be corrected by reading the bias level of the overscan area of each image, so far this has not been implemented in PixInsight. So the calibrated images show some small illumination differences between quadrants.
The solution I adopted here was to add a small pedestal to each quadrant to fix the differences. Juan Conejero (PixInsight Devopment Team) kindly wrote a PixelMath expression where I was able to specify the four pedestals independently:
               k1 = 1.0;
               k2 = 1.0;
               k3 = 1.0;
               k4 = 1.0;
               x0 = Trunc( Width()/2 );
               y0 = Trunc( Height()/2 );
               left = XPos() < x0;
               top = YPos() < y0;
               $target * iif( left, iif( top, k2, k3 ), iif( top, k1, k4 ) )
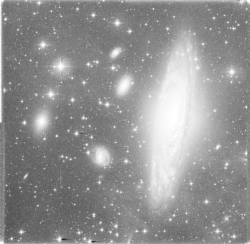
This PixelMath instance was applied to all calibrated images. In each image, pedestals (the values of the k1, k2, k3 and k4 variables in the expression above) were slightly modified, as the background oscillates around a 0.1% - 0.5% between them. On Figure 3 you can see the same image after fixing illumination differences with the above PixelMath expression.
Color Philosophy
Regarding color, these have been my two main goals for this work:
- Maximum hue richness.
- Maximum color deepness.
To achieve the first goal, the key is a filter set with good crossovers (i.e., two or more filters with good sensitivity on the same region of the spectrum). In this regard, photometric filters are outstanding. Here are the transmission curves of the Johnsonn and Sloan photometric filter sets available for LAICA:
http://www.caha.es/CAHA/Instruments/LAICA/filters_johnson.gif
http://www.caha.es/CAHA/Instruments/LAICA/filters_SDSS.gif
For this NGC 7331 image, I selected the Johnsonn B2 an V filters. I chosen the B2 filter because it has way more crossover with V than the B filter.
For the R channel, I chosen the Sloan r' because it cuts at 700 nm. The Johnsonn R cuts at 750 nm, but this can be counterproductive because it would mix a lot more continuum emission with H-alpha. A narrower R channel enhances nebulas inside galaxies.

Spectral response of the filters used: Johnsonn B2, Johnsonn V, and Sloan r'.
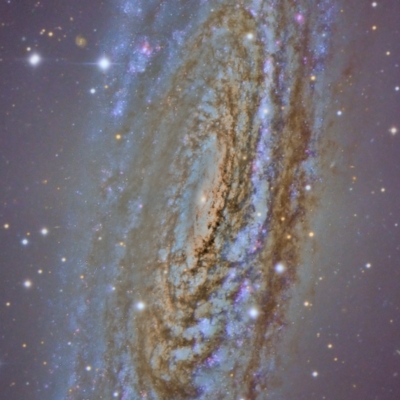
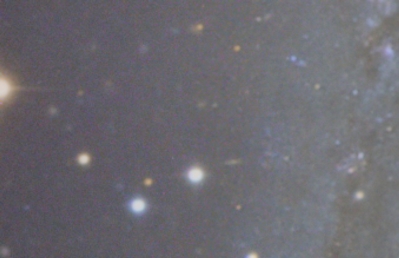
I think that a simple filter set as the one I've used here makes a much better job than other filters designed specifically for astrophotography. If you look at the full-resolution crop of the main galaxy on Figure 4 (click on the figure thumbnail to enlarge), you will see an immense variety of hues: from browns to pinks, reds, yellows, cyans and blues.
You can see even greens in this image! Just apply an average SCNR to this image, and you'll see that the galaxy bulb is in fact a bit greenish. Note that thanks to this bit of green the image shows an impressive color richness. In fact, I have no doubt in stating that, if you pursue good color in your astrophotos, in most cases the key color is green.
On the other hand, to achieve the maximum color deepness it is mandatory to collect all the light through color filters. Noise exists at all scales: from 1 pixel to 64 pixels; our image is not entirely significant data at any dimensional scale. This is especially true when you want to raise structures of extremely low surface brightness. These structures can sometimes have also very mutted colors. In this scenario, the LRGB method is very problematic because each time we are acquiring only luminance we are losing color information in the final result. Not only luminance must go deep: color information must be present throughout the entire image. And even more important: color data must be able to fully support luminance data. As you can see in my image, all pixels and all image structures carry significant color information.
Color Calibration
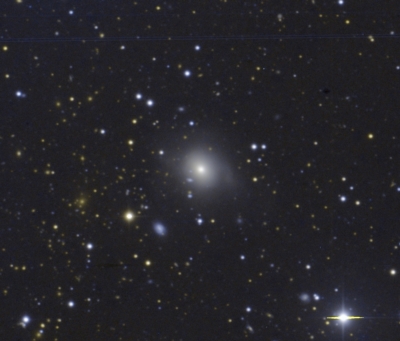
Figure 5— NGC 6363 taken with the Wide Field Imager of the Isaac Newton Telescope at the Roque de los Muchachos Observatory. Rodney Smith, Vicent J. Martínez, Fernando Ballesteros, Vicent Peris, IAC.
Color calibration was performed assuming that the sum of the whole light coming from NGC 7331 is pure white. This is, in my opinion, a good documentary argument. Being composed by (thermically) light-emitting objects, the colder objects will be shifted toward red, and the warmer ones toward blue. Also, as you can see, the resulting color balance preserves very well the characteristic color of H-alpha emitting regions on the main galaxy. H-alpha regions appear magenta due to the mixed light of hydrogen clouds with young stellar population.
I have used the same argument to process color images from the INT telescope. In this example shown on Figure 5, color calibration was performed assuming that the main elliptical galaxy is white. As you can see, the much more distant galaxy cluster at the left side is clearly shifted towards red due to its higher radial velocity.
Since the filter and camera combination is much less efficient in the blue region of the spectrum than in the red one, color calibration generates a lot of noise in the luminance, as you can see on Figure 6. This is why I have processed luminance and chrominance separately, where the latter is simply the average of the three B,V and r' images.
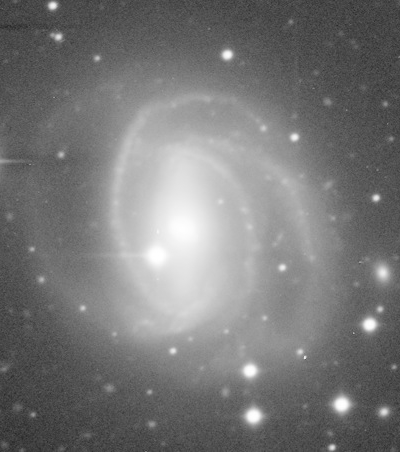

Figure 6— To the left, a crop of the luminance (average or red, green and blue). To the right, the same crop from the combined RGB image, after color calibration. Note the significant amount of noise transferred from chrominance to luminance.
Deconvolution
Deconvolution, even if we use regularized algorithms, does not make sense for low signal-to-noise ratio areas of the image. The problem is not poor regularization —the applied deconvolution algorithms are extremely efficient in this regard—, but just insufficient data.
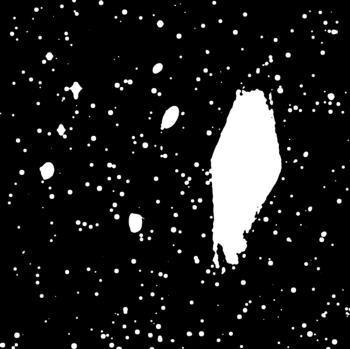
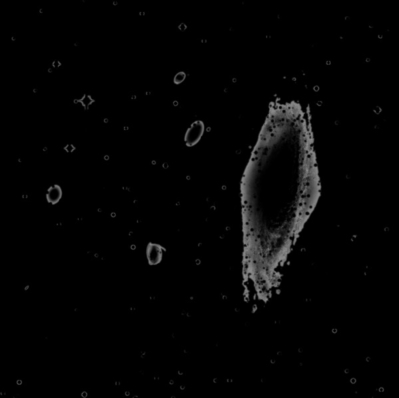
For this image, I have set an illumination threshold to apply deconvolution. It is simply a slightly blurred luminance mask. We can set this threshold through the Binarize process; in this case, the binarization threshold has been 0.0056, or 0.0006 above the mean sky background level (Figure 7).
This mask defines a limit beyond which the image, in my opinion, cannot benefit from deconvolution. I have employed the same mask also for noise reduction, as the noise after deconvolution is clearly different from the noise in the other areas of the image.
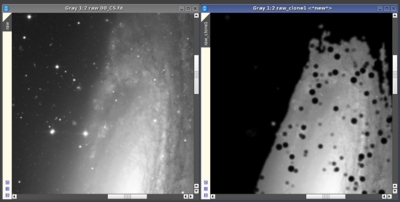
Figure 8— Deconvolution mask generated as the minimum combination of a thresholded luminance mask and a star mask.
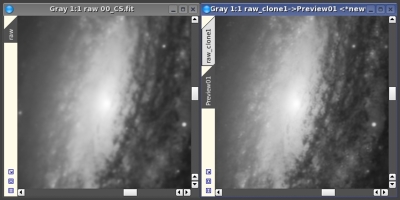
Figure 9— The luminance image before and after deconvolution with the regularized Richardson-Lucy algorithm (Deconvolution tool in PixInsight).
Deconvolution must be filtered through two different masks, since the first one cannot avoid the Gibbs effect, or ringing artifacts. The second mask I have used is a simple star mask generated with the ATrousWaveletTransform tool. This mask must select structures above a given contrast level. It must also protect the areas around these structures, to avoid any sight of ringing artifacts. This star mask is selected in the deringing section of the Deconvolution process, while the first mask must be activated for the image, in the usual way. So deconvolution has been applied through a combination of both masks (Figure 8).
The final result after regularized Richardson-Lucy deconvolution can be seen on Figure 9.
About the Dynamic Range of the Image
Figure 10— Left: Before applying the High Dynamic Range Wavelet Transform (HDRWT) algorithm. Right: Resulting image after applying the HDRWaveletTransform tool in PixInsight.
Since the beginning, we have been working with linear data all the time. From now on, we'll be working in an extremely non-linear way.The first step is to compress the dynamic range of the image. This can be done easily with the HDRWaveletTransform (HDRWT) tool in PixInsight. Before applying it, we will raise the midtones moderately. Figure 10 shows the result of applying the High Dynamic Range Wavelet Transform (HDRWT) algorithm.
Being a multiscale algorithm, the effectiveness of HDRWT depends on local constrast at different scales for each object. In this case, HDRWT worked very well for the core of NGC7331, but the image lacked contrast inside the companion galaxies. This can be verified on the crops included in Figure 11.
Furthermore, after HDRWT the image unveils a lot of hidden information when we stretch a bit more the histogram, as Figures 11 and 12 demonstrate. In the image of Figure 12 we bring out all the Integrated Flux Nebulas (IFN) quite well, but local contrast has been lost almost completely in the brightest parts of the image.
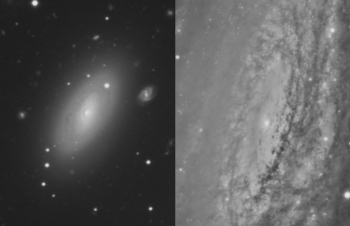
Figure 11— Two crops of the image after HDRWT, showing a lack of contrast in galaxy cores.
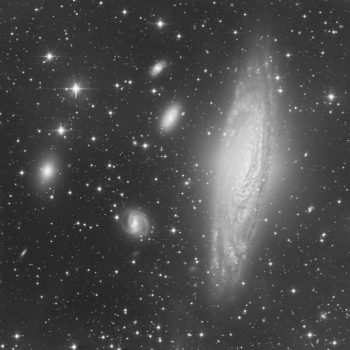
Figure 12— Stretching the histogram after HDRWT.
HDRWT works very well to do an initial dynamic range compression, but we cannot dominate completely the dynamic range of the image using only this algorithm. I'm going to explain my general workflow to overcome this problem using wavelet-based techniques.
Multiway wavelets processing
Once we have done the initial dynamic range compression (Figure 10), the workflow is as follows:
- Divide the image into different scale layers.
- Process each scale layer separately.
- Recombine all layers with the original (before HDRWT) image.
The first step is to isolate the medium- and large-scale structures from the smaller scales of the image. This can be accomplished in several ways. I use two techniques:
- Morphological filters applied through star masks. This consists of selecting the high-contrast, small-scale structures with a mask, then applying morphological filters to reduce their contrast and brightness.
- A rather simple but effective algorithm that I explained in the Spanish magazine Astronomía, which isolates large-scale structures, thus reducing ringing artifacts.
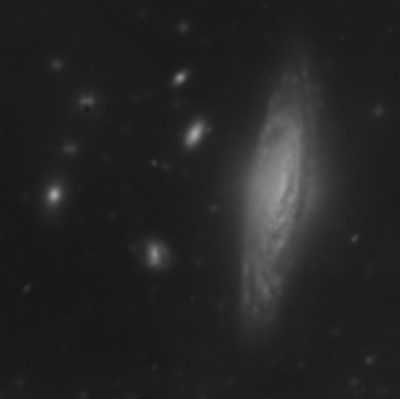
Figure 13— Thresholded luminance mask for deconvolution.
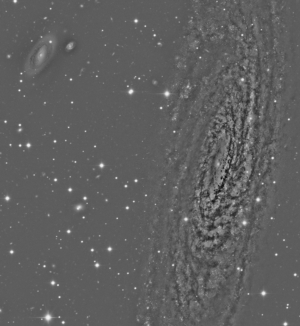
Figure 13 shows the large-scale component of this image. Once we have isolated this component, we can isolate also the small-scale components. This can be done with the ATrousWaveletTransform and PixelMath tools in PixInsight. One of the most important properties of our technique is that it allows us to work independently of the dynamic ranges of the objects in the image.
With this technique we can overcome the dynamic range problem in most cases. It works even in extremely adverse scenarios, as the image shown in Figure 14. This image has a dynamic range of 15 millions to 1. It is the combination of numerous exposures with a DSLR camera, ranging from 1 to 1/4000 seconds.
In the case of this NGC 7331 image, this technique worked really well, as you can verify on Figure 15. We have at this stage two images with the isolated small- and large-scale structures, respectively. Now it's time to process them separately. See, for example, how powerful a simple curves transformation can be in Figures 16a and 16b. In a similar way, Figure 17 shows the isolated large-scale image after applying a relatively simple process.
Small-scale component.
The final step is to recombine the two isolated images with the original one by means of a simple addition. The PixelMath expression is as follows:
original + SS*ks + LS*kl
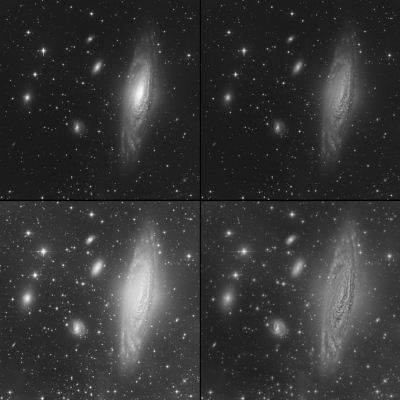
where ks and kl are two constants for varying the proportions in the mix, and SS, LS and original have the same meaning as before. Finally, on Figure 18 we can compare the image after the entire wavelet processing with the original one, with the HDRWT version, and the HDRWT version with the midtones raised.
If you want to look at full-resolution crops of the images corresponding to several stages of the wavelets processing, you can follow these links:
Figure 17 (left)— Large-scale structures after CurvesTransformation.
Figure 18 (right)— The entire wavelets processing. Upper-left: The nonlinear image before wavelets processing; Upper-right: After the initial dynamic range compression with HDRWT; Bottom-left: Stretched HDRWT result; Bottom-right: Result of combining the stretched HDRWT image with large-scale and small-scale structures processed separately.
Noise Reduction
I have applied three separate noise reduction procedures to this image, all of them using the ACDNR process in PixInsight. The first noise reduction is for the areas affected by residual noise intensification after deconvolution of the luminance. Since we have used a hard mask for deconvolution, this noise can be seen and identified very easily.
To achieve an effective noise reduction, I created a mask with a minimum operator applied to the deconvolution mask and an inverted luminance mask. The resulting mask (Figure 19) applies noise reduction to the areas with less signal inside deconvolved image regions. The result of this first noise reduction can be seen on Figure 20.
To complete noise reduction on the luminance, a second ACDNR instance was applied to the areas where deconvolution was not used. But, in these areas, we must filter ACDNR through a luminance mask, too. So I generated an additional mask by subtracting a luminance mask to the inverted deconvolution mask (Figure 21).
Finally, a slight noise reduction was applied to the chrominance through an inverted luminance mask, which can be seen on Figure 22.
It is important to point out that any color saturation increase must be applied after noise reduction for the chrominance. This is because noise in the chrominance tends to separate hues in the same chrominance structures. After noise reduction, we'll be able to raise color saturation for much fainter objects.
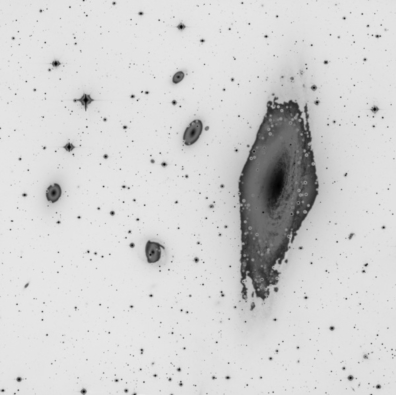
Figure 21— Noise reduction mask for the luminance.
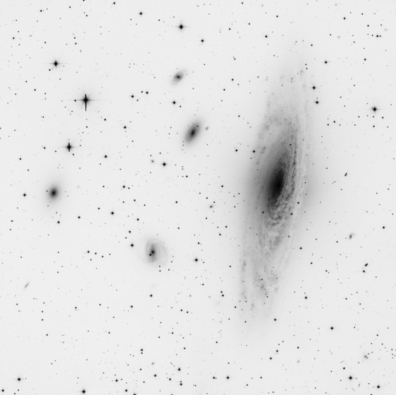
Figure 22— Noise reduction mask for the chrominance.
Finally, Figure 23 is a before/after comparison with a full-resolution crop of the image.
