WPP2 crashing PixInsight when starting image registration

swinston

Active member
I'm seeing WPP2 crash PixInsight (latest 1.8.8-9 release) after completing image calibration and beginning registration - this crash is 100% reproducible for me.

As the PixInsight process crashes, I don't get any logs :<

Looking in the Windows app logs I see the following:

Faulting application name: PixInsight.exe, version: 1.8.8.9, time stamp: 0x6131d50f
Faulting module name: ntdll.dll, version: 10.0.19041.1202, time stamp: 0x4f115fac
Exception code: 0xc0000374
Fault offset: 0x00000000000ff199
Faulting process id: 0x2e9c
Faulting application start time: 0x01d7a1077ace2616
Faulting application path: C:\Program Files\PixInsight\bin\PixInsight.exe
Faulting module path: C:\WINDOWS\SYSTEM32\ntdll.dll
Report Id: 8ba5154b-5c6b-41a1-8168-f60c5eb35b70
Faulting package full name:
Faulting package-relative application ID:

On one previous occasion I got an exception pop-up:
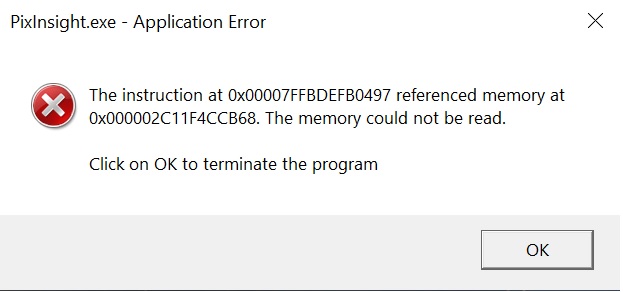
PI_exception.jpg


This was running the previous 1.8.8-8 release.

In all other crashes the application just exits without displaying any errors.
 
Looking back through the system logs I see a different earlier entry (this was before I upgraded to 1.8.8-9)

Faulting application name: PixInsight.exe, version: 1.8.8.8, time stamp: 0x60b522a2
Faulting module name: KERNELBASE.dll, version: 10.0.19041.1202, time stamp: 0xc9db1934
Exception code: 0xc0000602
Fault offset: 0x000000000010be3e
Faulting process id: 0x3370
Faulting application start time: 0x01d7a106484aba8e
Faulting application path: C:\Program Files\PixInsight\bin\PixInsight.exe
Faulting module path: C:\WINDOWS\System32\KERNELBASE.dll
Report Id: 3c623520-0274-438e-a18a-de48e20d356d
Faulting package full name:
Faulting package-relative application ID:
 
Hi @swinston,

would you be willing to share your files and the WBPP configuration you run to attempt to reproduce this crash on our machines? publicly or in private as you prefer.

Robyx
 
I can send you a private Dropbox link to the data files - it's about 60GB

And is there an easy way to dump all config settings? I'm basically just running WPP2 with the default settings...
 
I should also mention that if I run image registrations separately, on the calibrated images WPP2 created, it works just fine. The crash only happens when trying to do it all within WPP2
 
I can send you a private Dropbox link to the data files - it's about 60GB

And is there an easy way to dump all config settings? I'm basically just running WPP2 with the default settings...
yep thanks, you can use my PI email roberto.sartori@pixinsight.com.

Regarding WBPP a snapshot of the control panel and the list of customization you've made before running would be enough.
In the worst case you can create a WBPP icon instance on the workspace, save the project and share it, then I will be able to inspect your configuration entirely.

Robyx
 
I am able to reproduce the crash, it seems that the system is just running out of RAM memory during SubframeSelection (both with WBPP or manually).
Your images are quite large and when I use all 24 cores SubframeSelector requires more than 32Gb of RAM, my system runs out of memory and crashes. Reducing down to fewer cores helps but, of course, slows down the processing a bit depending on how many cores you'll cut.

ImageIntegration is also quite demanding in terms of RAM since you're stacking 130 frames, each image is 230Mb large and you have a total of 30Gb Gb of data to be processed (plus some auxiliary structures used by the algorithms).

One more concern, it could happen that when you run WBPP you'll experience a bit more RAM usage so a stage that runs out of memory with WBPP could run successfully when done manually (it depends on how close you are getting to your RAM limit).

I think that upgrading to 64Gb is the better choice if you are planning to have such an amount of data quite often :)
 
I actually have 64GB so not sure that's the issue here.

I'll run WPP2 again and monitor how much memory is being used while processing this stack, but I know in the past on similarly sized stacks, peak memory usage was not an issue.
 
> Your images are quite large and when I use all 24 cores SubframeSelector requires more than 32Gb of RAM, my system runs out of memory and crashes

Just an additional data point: My system only has 4 cores / 8 threads (I know, time for an upgrade ;), and when running SubframeSelector, peak memory usage is only around 22% of available system memory...
 
Ok, actually I don't have any other way to reproduce the crash with your dataset. I've tried with Linux and proper memory configuration and on Windows 10, both complete flawlessly.

Do you have the chance to grab a screen recording of the console to see exactly at which step it crashes and maybe by chance to get an error message just before it disappear?
 
Very hard to grab a screen grab at the moment it crashes - happens very quickly - no error message displayed in the console that I can see before the app disappears.

It has clearly completed the calibration steps (all images are calibrated) and has gotten as far as creating the sub-folder where the registered Ha images should go, but never gets to start registering any images.

Not sure what happens between "folder creation" and "start registration", but that's where it's crashing each time :<.

Any additional debugging I can enable? Maybe a debug version of the app with additional instrumentation I can run?
 
Update: I rolled back to 1,8,8-8 and WBP was able to complete without any issues on a stack of almost 600 images.

So this problem appears to have been introduced in 1.8.8-9
 
As Roberto has said above, we are unable to reproduce this problem with version 1.8.8-9. No similar problem has been reported before on any platform with the latest version, AFAIK.
 
> As Roberto has said above, we are unable to reproduce this problem with version 1.8.8-9

In post #7 above Roberto said that he was able to reproduce a crash with 1.8.8-9:

> I am able to reproduce the crash, it seems that the system is just running out of RAM memory during SubframeSelection

And I can now confirm that the issue does not occur in 1.8.8-8, but is 100% reproducible with 1.8.8-9. Clearly something changed between 1.8.8-8 and the 1.8.8-9 release.

I am happy to run debug versions of the app or versions with more logging enabled, if it helps track this down.
 
In post #7 above Roberto said that he was able to reproduce a crash with 1.8.8-9:

Indeed, but only by restricting the amount of available physical memory severely. In this case what we find is an expected out of memory condition. In theory this should be 'solvable' (but with a considerable performance penalty) by configuring the amount of swap space (virtual memory) available to running processes at the operating system level.
 
I don't see anything in Roberto's post that states he restricted the amount of memory severely? He was running with 32GB, which is a pretty common config for PI users. I happen to be running 64GB.

But again: Issue does not happen in 1.8.8-8, running within the same memory constraints. Are you saying that 1.8.8-9 is managing memory differently and now requires significant additional memory?

And what is the proposed next step here? I have offered to help debug, if you wish. If not then I guess I'm stuck on 1.8.8-8 until maybe a fix makes it into a future release?
 
> In this case what we find is an expected out of memory condition.

And just an additional point of clarification: This crash happens during Image Registration where the memory load on my system never gets above 25%, so not even close to running out of physical memory.
 
I am sorry to say that we cannot reproduce the problem that you are describing under normal conditions. If the memory consumption is so low then there must be an additional factor that is causing it.

Faulting module name: KERNELBASE.dll, version: 10.0.19041.1202, time stamp: 0xc9db1934

Note that the module that is failing is not part of PixInsight, but a system component which is beyond our control. Obviously PixInsight is triggering the problem, but it is not happening in our code, at least from the information that you have provided.
 
> Obviously PixInsight is triggering the problem, but it is not happening in our code

I think this is a bit disingenuous. My guess is that PI is making an illegal memory access and that is what is triggering the heap corruption exception ( 0xc0000374) in kernelbase.dll. The exception doesn't indicate kernelbase is "failing", in fact it indicates it is doing it's job, catching the heap corruption and killing the app (PixInsight) that caused the issue.

I will say it is disappointing that despite having a 100% reproducible failure case + a willingness (from me) to help identify the issue, there is no mechanism to provide additional information (e.g. running a debug version with additional logging). Given PI has a large and diverse customer base, with a large and diverse range of set-ups, it would seem to be a good idea to find a way to debug issues even if they cannot be reproduced on the PI developers set-ups'.

Anyway, as there doesn't appear to be any appetite from the PI team to debug this further, I guess I will have to stick with 1.8.8-8 and hope / wait to see if this issue is addressed through some future update.

Edit: Re-reading my own posts I see I may be coming across too harshly here. I really love PI as a product and genuinely just want to be able to continue using it. WBP2 is awesome - really simplifies my processing pipeline so I really hope it gets back to a working state (for me). And I also recognize that solving issues that are apparently only happening on one users system can't be the highest priority.
 
Last edited:
fwiw: This is the WinDbg analysis of the dump file which appears to be showing a potentially bad parameter being passed to qmljsDebugArgumentsString()


0:000> !analyze -v
*******************************************************************************
* *
* Exception Analysis *
* *
*******************************************************************************


KEY_VALUES_STRING: 1

Key : Analysis.CPU.mSec
Value: 1280

Key : Analysis.DebugAnalysisManager
Value: Create

Key : Analysis.Elapsed.mSec
Value: 8994

Key : Analysis.Init.CPU.mSec
Value: 484

Key : Analysis.Init.Elapsed.mSec
Value: 35088

Key : Analysis.Memory.CommitPeak.Mb
Value: 107

Key : FailFast.Name
Value: FATAL_APP_EXIT

Key : FailFast.Type
Value: 7

Key : Timeline.Process.Start.DeltaSec
Value: 3

Key : WER.OS.Branch
Value: vb_release

Key : WER.OS.Timestamp
Value: 2019-12-06T14:06:00Z

Key : WER.OS.Version
Value: 10.0.19041.1

Key : WER.Process.Version
Value: 1.8.8.8


NTGLOBALFLAG: 0

PROCESS_BAM_CURRENT_THROTTLED: 0

PROCESS_BAM_PREVIOUS_THROTTLED: 0

APPLICATION_VERIFIER_FLAGS: 0

CONTEXT: (.ecxr)
rax=0000000000000001 rbx=00007ffcdcfba8f8 rcx=0000000000000007
rdx=0000009c081fe780 rsi=0000009c081ff0d0 rdi=0000009c081fe780
rip=00007ffcd81d09f8 rsp=0000009c081fe6d0 rbp=0000000000000001
r8=0000009c081fe730 r9=0000000000000001 r10=0000000000008000
r11=0000009c081fe550 r12=0000000000000002 r13=00000000ffffffff
r14=0000009c081fe8a8 r15=000001e4a5da7420
iopl=0 nv up ei pl nz na pe nc
cs=0033 ss=002b ds=002b es=002b fs=0053 gs=002b efl=00000202
Qt5Core!QCoreApplicationPrivate::qmljsDebugArgumentsString+0x98:
00007ffc`d81d09f8 cd29 int 29h
Resetting default scope

EXCEPTION_RECORD: (.exr -1)
ExceptionAddress: 00007ffcd81d09f8 (Qt5Core!QCoreApplicationPrivate::qmljsDebugArgumentsString+0x0000000000000098)
ExceptionCode: c0000409 (Security check failure or stack buffer overrun)
ExceptionFlags: 00000001
NumberParameters: 1
Parameter[0]: 0000000000000007
Subcode: 0x7 FAST_FAIL_FATAL_APP_EXIT

PROCESS_NAME: PixInsight.exe

ERROR_CODE: (NTSTATUS) 0xc0000409 - The system detected an overrun of a stack-based buffer in this application. This overrun could potentially allow a malicious user to gain control of this application.

EXCEPTION_CODE_STR: c0000409

EXCEPTION_PARAMETER1: 0000000000000007

STACK_TEXT:
0000009c`081fe6d0 00007ffc`d81cec6d : 0000009c`081fe738 00007ffc`dcfba8f8 0000009c`081ff0d0 00007ffc`dd29d332 : Qt5Core!QCoreApplicationPrivate::qmljsDebugArgumentsString+0x98
0000009c`081fe700 00007ffc`dcca1a91 : 000001e4`aad7dc80 00007ffc`dcfba8f8 00000000`00000000 00000000`00000000 : Qt5Core!QMessageLogger::fatal+0x6d
0000009c`081fe760 00007ffc`dcddf5e3 : 000001e4`aad7db00 00000000`000002e0 00000000`00000000 00000000`00000000 : Qt5Widgets!QWidgetPrivate::QWidgetPrivate+0x1b1
0000009c`081fe7b0 00007ffc`dce73bde : 00000000`000002e0 00007ffc`d81e0259 00000000`00000000 00000000`00000008 : Qt5Widgets!QDialogPrivate::QDialogPrivate+0x13
0000009c`081fe7e0 00007ffc`dce73b14 : 0000009c`081ff0d0 00007ffc`d826a0cb 00000000`00000000 00007ffd`290947b1 : Qt5Widgets!QMessageBox::QMessageBox+0x10e
0000009c`081fe810 00007ffc`dce7784c : 00000000`00000400 00000000`00000000 00000000`00000000 000001e4`a5da6388 : Qt5Widgets!QMessageBox::QMessageBox+0x44
0000009c`081fe860 00007ffc`dce75691 : 0000009c`00000001 00000000`00000000 000001e4`a5da6388 00000000`00000002 : Qt5Widgets!QMessageBox::showEvent+0x1ec
0000009c`081fe900 00007ff6`d5395dc7 : 0000009c`081fefa8 0000009c`081ff0d0 00000000`00000000 00000000`00000000 : Qt5Widgets!QMessageBox::information+0x21
0000009c`081fe940 00007ff6`d6088a97 : 00000000`00000000 000001e4`a5da7420 00000000`ffffffff ffffffff`ffffff00 : PixInsight+0xf5dc7
0000009c`081ffc60 00007ff6`d6083f6e : 00000000`00000000 00000000`00000000 00000000`00000000 00000000`00000000 : PixInsight!InitializePixInsightModule+0x2358e7
0000009c`081ffcf0 00007ffd`280a7034 : 00000000`00000000 00000000`00000000 00000000`00000000 00000000`00000000 : PixInsight!InitializePixInsightModule+0x230dbe
0000009c`081ffd30 00007ffd`290c2651 : 00000000`00000000 00000000`00000000 00000000`00000000 00000000`00000000 : kernel32!BaseThreadInitThunk+0x14
0000009c`081ffd60 00000000`00000000 : 00000000`00000000 00000000`00000000 00000000`00000000 00000000`00000000 : ntdll!RtlUserThreadStart+0x21


SYMBOL_NAME: Qt5Core!QCoreApplicationPrivate::qmljsDebugArgumentsString+98

MODULE_NAME: Qt5Core

IMAGE_NAME: Qt5Core.dll

STACK_COMMAND: ~0s ; .ecxr ; kb

FAILURE_BUCKET_ID: FAIL_FAST_FATAL_APP_EXIT_c0000409_Qt5Core.dll!QCoreApplicationPrivate::qmljsDebugArgumentsString

OS_VERSION: 10.0.19041.1

BUILDLAB_STR: vb_release

OSPLATFORM_TYPE: x64

OSNAME: Windows 10

IMAGE_VERSION: 5.15.4.0

FAILURE_ID_HASH: {ce113b38-2589-35b3-af2b-4f6f27571558}

Followup: MachineOwner
---------
 
Back
Top