
Hi all,
I want to describe the technique I designed for master bias generation. I decided to design this technique when I was working with the old camera at Calar Alto. This camera had terrible column defects which were a challenge to correctly calibrate the light image. A master bias shows these defects:
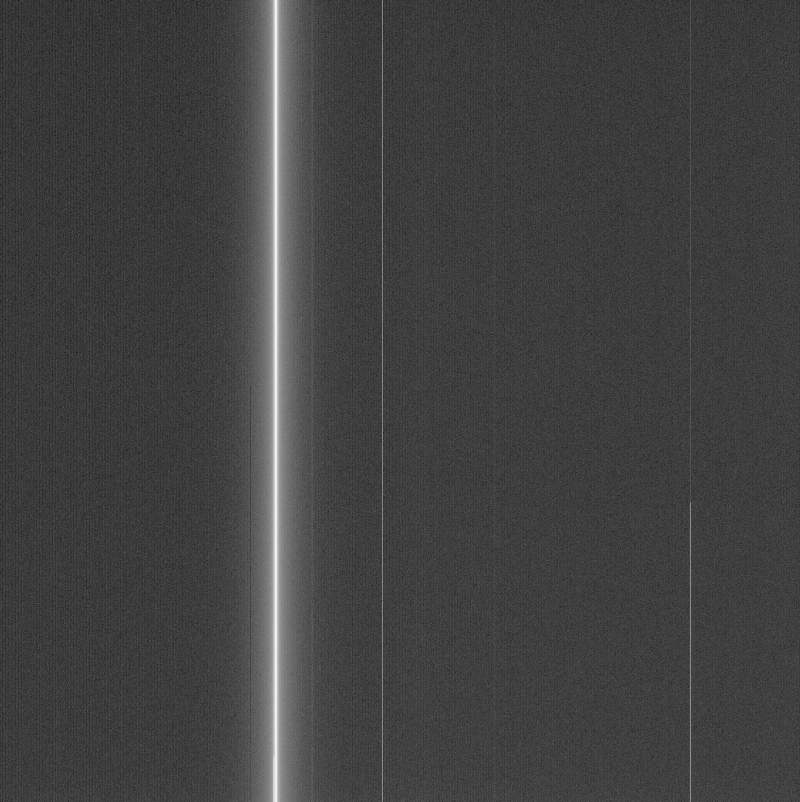
This is the sensor used to produce most of the images I released from Calar Alto (and more coming). The idea I had in mind was how to produce the best master bias with the higher possible signal to noise ratio. The main problem I had was the extremely low readout time -3 min.- because it was not possible to have a large amount of bias frames to integrate. I made an experiment with a Finger Lakes camera having a Truesense CCD sensor and found that, by integrating a high number of bias frames, the master bias was well characterized by two different structures:
- A small scale pattern consisting of vertical lines.
- A large scale pattern consisting of soft gradients.
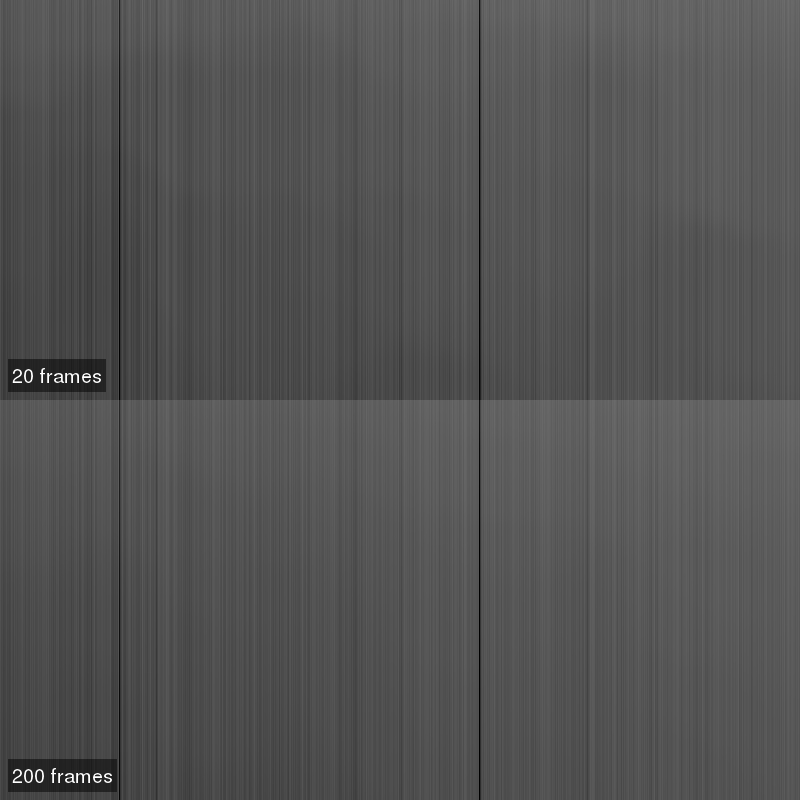
The goal of the superbias is to reconstruct a model -based on these two discrete structure types- of the bias signal with a low quality master bias image. First, take a look at this small crop of a bias signal. The vertical strip contains several integrations from a 200-frame data set:
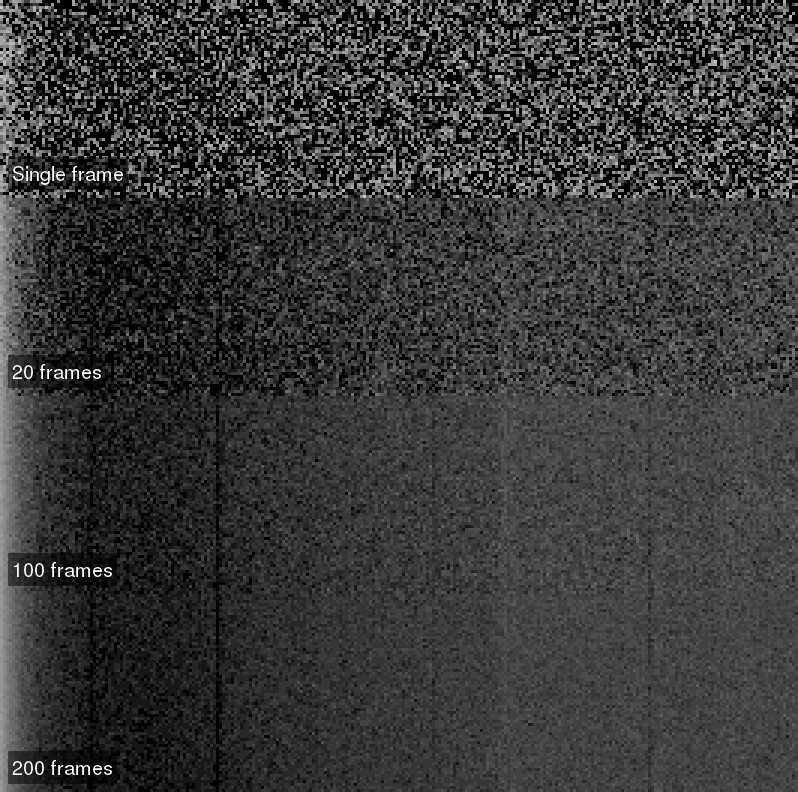
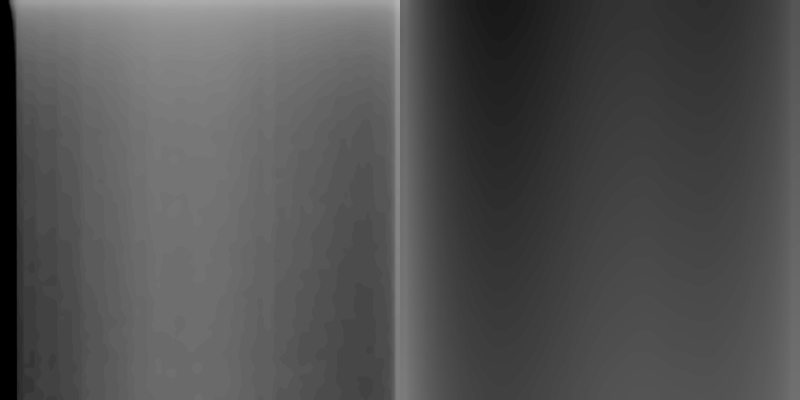
See that, even integrating 20 frames, the read noise dominates over the column pattern. As we integrate more frames, the column structuture starts to appear. Take into account that this cannot be done simply by averaging column values because in most bias images there are large scale structures that are not vertically distributed. We can see these structures in the below image of two different sensors. I deliberately posterized the images to clearly show the gradient orientation:
Therefore, the superbias is a combination of both characteristic scale structures. Let's see the superbias calculated from a 20-frame master bias:
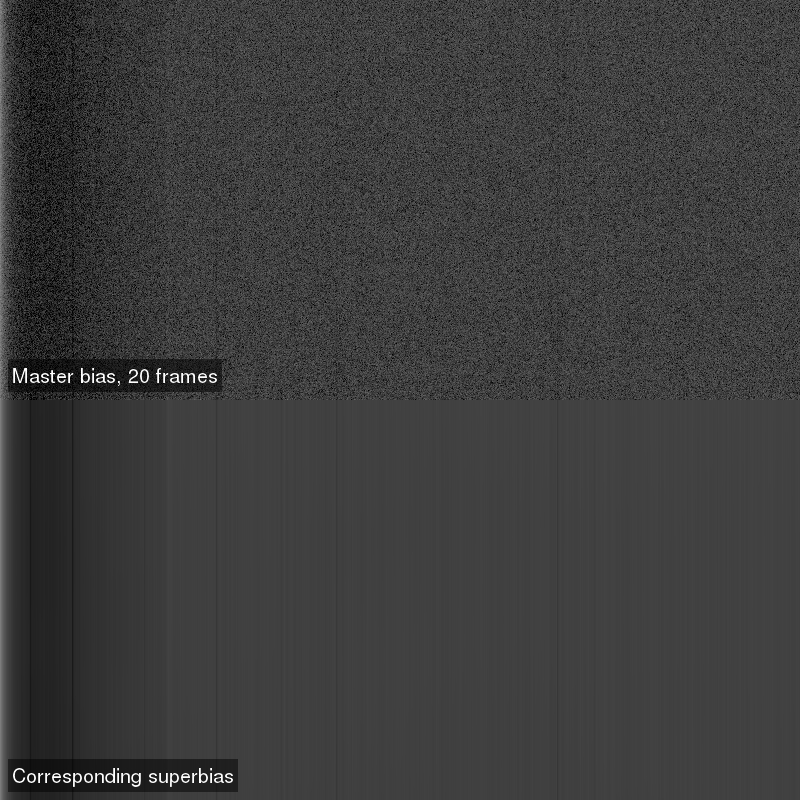
If we compare this superbias to another superbias built from the full data set, the main difference between both images is the increased signal to noise ratio of the large scale structures:
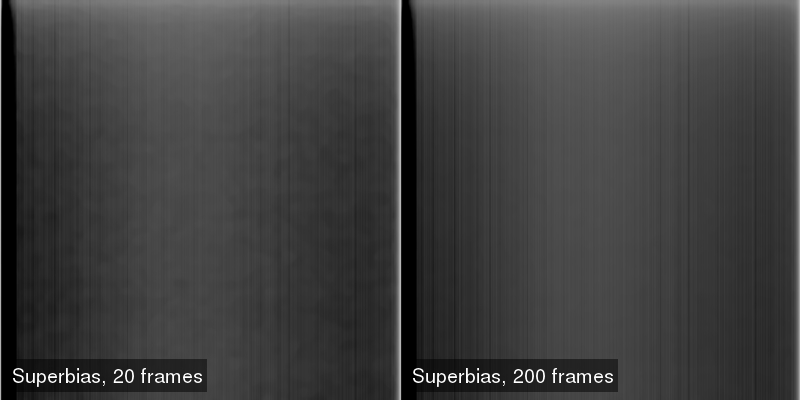
Please take into account that these images are heavily stretched; see the single bias image in vertical strip, which has the same stretching, to have a comparison point with the actual read noise of the camera. When we look at these images at full resolution, the reconstructed colum pattern is very similar in both images:
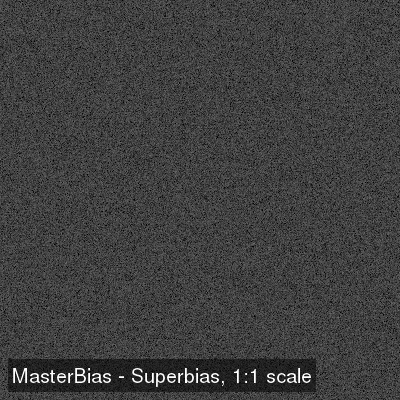
The superbias technique was designed for cameras with a bias signal where the only significative small scale structures correspond to the vertical pattern. In this case (a Truesense KAF16803 sensor), we can actually demonstrate that the residual, not modelled part of the image is random noise. When we subtract a superbias image from the original, integrated master bias, the result shows a uniform, random distribution:
Assuming that this residual is random white noise, its intensity should decrease by the square root of the number of integrated images. If there is a fixed pattern?the same pixel-to-pixel variations that we can find, for instance, in dark and flat frames?, then the decrease in noise intensity won't follow this law because the pattern has a fixed, constant intensity.
We are going to do this test by subtracting the superbias generated from the 200-frame master bias. We are also going to test if the superbias technique works well with lower quality master bias images, so we are doing the same noise measurement taking as reference a superbias generated from a 25-frame master bias. We'll subtract these superbias images from a set of master bias frames, which are the integrations of 25, 50, 75, 100, 125, 150, 175 and 200 randomly selected images.
The results of this experiment are summarized in the table below:
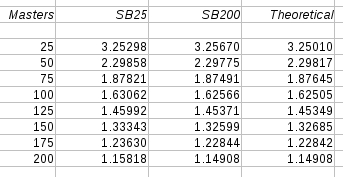
Table values are expressed in units of 10-5. The first column indicates the master bias used to get the residual image. The second and third columns are the noise intensities measured on the residuals after subtracting the superbias images from the 25- and 200-frame master bias, respectively. To evaluate noise intensities, we have used the Qn scale estimator of Rousseeuw and Croux.[1] The last column is the theoretical noise increase computed from the square root of the number of integrated frames. We can see clearly that the residual image is purely random noise, which demonstrates that the column pattern and medium-scale structures of the bias signal is very well modelled with the superbias technique in this case.
[1] P.J. Rousseeuw and C. Croux (1993), Alternatives to the Median Absolute Deviation, Journal of the American Statistical Association, Vol. 88, pp. 1273?1283.
You can download the set of master bias images here.
Best regards,
Vicent.
I want to describe the technique I designed for master bias generation. I decided to design this technique when I was working with the old camera at Calar Alto. This camera had terrible column defects which were a challenge to correctly calibrate the light image. A master bias shows these defects:
This is the sensor used to produce most of the images I released from Calar Alto (and more coming). The idea I had in mind was how to produce the best master bias with the higher possible signal to noise ratio. The main problem I had was the extremely low readout time -3 min.- because it was not possible to have a large amount of bias frames to integrate. I made an experiment with a Finger Lakes camera having a Truesense CCD sensor and found that, by integrating a high number of bias frames, the master bias was well characterized by two different structures:
- A small scale pattern consisting of vertical lines.
- A large scale pattern consisting of soft gradients.
The goal of the superbias is to reconstruct a model -based on these two discrete structure types- of the bias signal with a low quality master bias image. First, take a look at this small crop of a bias signal. The vertical strip contains several integrations from a 200-frame data set:
See that, even integrating 20 frames, the read noise dominates over the column pattern. As we integrate more frames, the column structuture starts to appear. Take into account that this cannot be done simply by averaging column values because in most bias images there are large scale structures that are not vertically distributed. We can see these structures in the below image of two different sensors. I deliberately posterized the images to clearly show the gradient orientation:
Therefore, the superbias is a combination of both characteristic scale structures. Let's see the superbias calculated from a 20-frame master bias:
If we compare this superbias to another superbias built from the full data set, the main difference between both images is the increased signal to noise ratio of the large scale structures:
Please take into account that these images are heavily stretched; see the single bias image in vertical strip, which has the same stretching, to have a comparison point with the actual read noise of the camera. When we look at these images at full resolution, the reconstructed colum pattern is very similar in both images:
The superbias technique was designed for cameras with a bias signal where the only significative small scale structures correspond to the vertical pattern. In this case (a Truesense KAF16803 sensor), we can actually demonstrate that the residual, not modelled part of the image is random noise. When we subtract a superbias image from the original, integrated master bias, the result shows a uniform, random distribution:
Assuming that this residual is random white noise, its intensity should decrease by the square root of the number of integrated images. If there is a fixed pattern?the same pixel-to-pixel variations that we can find, for instance, in dark and flat frames?, then the decrease in noise intensity won't follow this law because the pattern has a fixed, constant intensity.
We are going to do this test by subtracting the superbias generated from the 200-frame master bias. We are also going to test if the superbias technique works well with lower quality master bias images, so we are doing the same noise measurement taking as reference a superbias generated from a 25-frame master bias. We'll subtract these superbias images from a set of master bias frames, which are the integrations of 25, 50, 75, 100, 125, 150, 175 and 200 randomly selected images.
The results of this experiment are summarized in the table below:
Table values are expressed in units of 10-5. The first column indicates the master bias used to get the residual image. The second and third columns are the noise intensities measured on the residuals after subtracting the superbias images from the 25- and 200-frame master bias, respectively. To evaluate noise intensities, we have used the Qn scale estimator of Rousseeuw and Croux.[1] The last column is the theoretical noise increase computed from the square root of the number of integrated frames. We can see clearly that the residual image is purely random noise, which demonstrates that the column pattern and medium-scale structures of the bias signal is very well modelled with the superbias technique in this case.
[1] P.J. Rousseeuw and C. Croux (1993), Alternatives to the Median Absolute Deviation, Journal of the American Statistical Association, Vol. 88, pp. 1273?1283.
You can download the set of master bias images here.
Best regards,
Vicent.