Random thick horizontal bands on integration

IanB

Member
I occasionally find 'wide' horizontal bands when I integrate. If I reintegrate the same data by pressing 'apply global', the position of the bands will change or even [thankfully] disappear. Example below from data from a Canon CR2 files although I get the same things with fits files from my QHY163C camera and clearly not Canon banding. Since the bands move, it can't be something wrong with the subs. I suspect something with my PC rather than PI itself. Anyone any ideas on what might be causing this or how to stop it?

[Intel i7-8700, 32GB ram, Win10 64bit.]
Capture.JPG
 
No idea, but the colours are suggestive - bands of yellow (B=0), cyan (R=0) and magenta (G=0). The bands are only in the image, so not a display problem. It would be interesting to see what the bands look like at 1:1 scale.
 
... actually, second thoughts about the display hardware ... I don't know how much the PI display interface uses modern display card functions (e.g. OpenGL functions). If, for example, the image rescaling is done by the graphics card hardware, this could very well be a graphics card issue.
 
Thanks for responding. I can't see any setting that let me control what memory or CPU to used. If I understand what you are saying, you think [and this did cross my mind] that a portion of one (or two) colour channel is being dropped. But this must be during the stacking as if a ABE process is carried out, then the same lines are present - although they are different colour - implying that it is in the data itself and not the display. Stupidly I didn't keep those images I posted above and although I restacked the same dataset 9 times, it didn't reoccur despite taking 4 repeats to get one without the lines!
 
My suspicion is that there is nothing wrong with the image processing, or the images. I think it may be an intermittent problem with the display card hardware (assuming PI uses hardware support for operations such as image display rescaling). You can test this hypothesis by seeing if the artefacts change with display scale (zoom factor).
 
The 'bands' do not change with zoom and seem 'real' in the data. Looking at the histogram displays on the autostretched raw data, it is clear that the green channel just disappears [in this particular case] (the black edges on the image are due to the alignment as this was a comet star align). The ABE modified image now gives reasonable backgrounds but with magenta lines...

I must admit I've never understood why I get the green bias in the first place. Canon Raw [cr2] files opened in photoshop look fine colour balance-wise but the same file processed in PI followed by a standard RGGB debayer gives green. Similar with Fits files from my QHY163c camera. This may be a red herring of course.
 

Attachments

  • Capture.JPG
    Capture.JPG
    31.8 KB · Views: 49
  • Capture1.JPG
    Capture1.JPG
    21.4 KB · Views: 44
  • Capture2.JPG
    Capture2.JPG
    22.2 KB · Views: 65
  • Capture3.JPG
    Capture3.JPG
    57.6 KB · Views: 42
I expect that by default photoshop loads and applies the camera white balance, whereas the PI default (in RAW format preferences) is no white balance. You can set PI to load the camera white balance - but that then depends on selecting a "meaningful" white balance for the camera, and this is not an obvious choice for astrophotography (6500K / CIE D65 white point would be a reasonable choice). At the risk of sounding like a cracked record (do you remember those?): there is no correct white balance.
I confess I'm out of ideas for the bands. When you say "real in the data" do you mean that they are saved / restored when you save / restore an image?
 
Thank you again for responding. If I close down PI and then reopen the xisf file, the lines are still there in the same place. Similarly if I save the xisf as tiff or fit format, and restart PI and load, the lines are there. That what makes me think it is real in the stacked data. I first noticed this with large datasets... 100 fits files on a comet but the recent instance was with 8 files - initially raw format. I can live with this but it can be a pain.

White balance is [now better] understood... I do remember the clicks and grinding noises of what youngsters call vinyl! I have a load of records in my loft...
 
On the bands, my thoughts follow the following track:
  • If it was a PI bug lots of people would be reporting it
  • I can't think of a non-PI software component that would be likely to cause this sort of effect
  • so perhaps hardware...
  • since it is a stable feature of images, perhaps a memory problem - but memory problems would kill lots of other things, so...
  • ... perhaps, if PI uses display card capability for some image processing functions, it could be display card hardware (and display hardware might be more likely to be channel-selective)
  • this sort of (intermittent) hardware problem is often:
    • temperature-related (overheating), or
    • (DC) PSU related (low voltage or noise) - often itself temperature-related
... but where do you go from there (other than to a well-equipped electronics maintenance workshop)?:rolleyes:
 
Thanks for your thoughts. I did have a CPU undercooling problem earlier in the year, but that has been fixed - it probably now probably overcooled! Looking at utilization and temps during integration, all 12 CPU cores do sometimes run flat out with maximum temps 55-60C but graphics CPU has no change on memory, temp or utilization. No obvious voltage issues to my [untrained] eye. I guess I have to just live with it... I might try and move the PI swap file directories off the root SSD drive [but it'll be slower]. I agree that if it was a PI bug, the forums would be full of reports, hence my original comment to that effect. I can live with it!
 
In the FWIW department, I've been seeing similar bands in the processing I've done recently These are from both CR2 and FITS files, both types captured and output from Sequence Generator Pro. I've spent untold hours trying different combinations, but so far have been unable to isolate the problem. The issue seems to have started a month or so ago. I'm on a Mac Pro, so I don't think it's a Windows or GPU specific issue. More digging needed...
 
At first sight this looks like a thread synchronization issue. Perhaps you have found a bug that manifests only under very specific conditions and with some seldom used combination of parameters. This is compatible with the possibility of a bug in an important tool that has passed unnoticed.

However, since you have not specified any information about the specific parameters that you are using on the ImageIntegration tool, or other tools that might be involved, I cannot say anything useful to help you. So the first thing to do is, as always, provide us with sufficient information to diagnose the problem. This includes, without limitation, a full description of the processes and parameters used, and maybe a reduced data set where the problem can be reproduced, as appropriate.
 
... perhaps, if PI uses display card capability for some image processing functions, it could be display card hardware (and display hardware might be more likely to be channel-selective)

GPU resources are used intensively by default (through OpenGL or a suitable emulation (Windows)) exclusively for screen rendering operations. They are not used for image processing tasks in current versions of PixInsight.
 
Juan, thanks for your input. My apologies for not giving details earlier as I suspected it was a local machine issue rather than one with the excellent PI software.

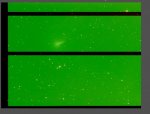
Some history. I first noticed this effect back in March when integrating big datasets from my QHY163C camera, acquired using Sequence Generator Lite. The 107 fit files were then calibrated with bias, dark and flats and saved in xisf format, cosmetic corrected, debayered and star aligned. I then created local normalisation files with the default settings. Integration settings: with Combination: Average, Normalisation: Local normalisation, Weights: Noise evaluation with pixel rejection: Percentile clipping, with local normalisation. Other setting at default. Screenshot on OneDrive. On integration, I found the result had these lines of a dropped colour. I repeated the integration 5 times (I think) before I got one without these artefacts. At that point I stopped and moved on.

Moving forward, last week I took 6 images on a Canon 750D camera in CR2 format. Manually triggered so no control software. On integration, a similar thing happened - banding as first image I posted. After 4 repeat integrations, I had a successful one and stopped. My suspicion that the effect was due to the large number [a rarity for me] of files was no longer possible, so I enquired about this problem on the forum.

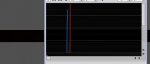
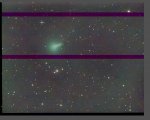
Given the comments, I wondered if this was a swap file issue so I decided to try and move the swap files to a different drive but saw the warning pop-up about not to do this on a mechanical drive. Instead, I reduced the number of swap files [C:\TEMP ] on the SSD to 8 - from the 12 which had seemed [marginally] better from the PI Benchmark process. [Screenshot of Preferences tab on OneDrive] Yesterday I tried to reproduce this banding with the 6 file set and I find I cannot after 13 attempts. I have now integrated the 107 fileset over 10 times with the 8 swap files and again no banding issues. Switching back to 12, second and third reintegration gave bands. Sometimes the bands are not obvious within the overall green bias [did I miss them on the 8 swapfile tests?] and only become clear with a subtractive ABE [default settings]. Closer inspection reveals that star colours are incorrect on original integration. This morning I found some integrations with 8 swapfiles giving banding.

I now have a 20 file subset which show fairly repeatedly, but not every time, the banding issue on integration with 12 swap files and occasionally 8 swap files.. The problem seemed much more frequent on the 12 swap file setting.

I hope this is what you need. I have uploaded the 20 subs [zipped] to onedrive together with a screenshot of the integration settings and four example integration results from the 20 file subset.

The onedrive address is https://1drv.ms/u/s!Ajb0X0vgvXvUgdocPzxT9x5syxt-hA?e=tRsdwx

System:
Processor: Intel Core i7-8700@ 3.2GHz,
Mobo: B360M AORUS Gaming 3 with 32GB ram,
Graphics Card: NVidea GeForce GTX 1050 Ti
System Disk: Samsung SSD 860 EVO M.2 1TB
OS: Win10 Home 64bit build 19041.572
PI version: 1.8.8-6
 
Hi Ian,

Thank you for uploading these data. I'm traveling and cannot download them right now, but I'll do as soon as I return to our lab, and will let you know what I find.
 
Thanks Juan. The problem is just so inconsistent but also frustrating! Thankfully, it doesn't occur that much.
 
Hi Ian,

I cannot reproduce the problem you have described with ImageIntegration. Your 20 files integrate perfectly with the parameters you've used on our machines, on all platforms, in all of my tests. I'm afraid this is a strange machine-specific issue. I suggest that you try on a different computer.
 
Thanks for trying. That was what I suspected ( machine-specific issue ) all along and why I didn't post in the 'Bug Reports' section.
 
To give some closure on this in case others ever get a similar effect.

I have identified that one of my four Corsair 8Gb DRAM modules had a [for want of a better word] a stuck bit - identified using memtest86. The module pair has been replaced and I've not had the issue since despite maybe 30 integrations on data that I had shown the error previously. Thanks for everyone's help.
 
Back
Top