adm
Member
Hello,
I was processing some data made available publicly by an observatory and I came across something curious in the statistics from the flat frames. I ran the batch statistics on the flat frames for each of the L, R, G, B, and Ha and plotted the mean and variance for each frame. The full details are in the spreadsheet attached.
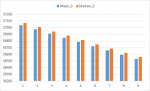
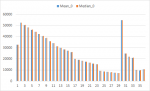
Here are the mean and medians from each:
Other than the Ha, all the others seem to have this sudden peak of the mean value towards the last 1/4 or 1/5 of the flat frames. What could be the cause of this? And why does it not happen in the Ha? Have you seen something like this in your flat frames too?
Thanks.
I was processing some data made available publicly by an observatory and I came across something curious in the statistics from the flat frames. I ran the batch statistics on the flat frames for each of the L, R, G, B, and Ha and plotted the mean and variance for each frame. The full details are in the spreadsheet attached.
Here are the mean and medians from each:
| L |
|
| R | |
| G | |
| B | |
| Ha |
Other than the Ha, all the others seem to have this sudden peak of the mean value towards the last 1/4 or 1/5 of the flat frames. What could be the cause of this? And why does it not happen in the Ha? Have you seen something like this in your flat frames too?
Thanks.