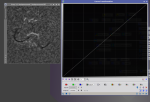
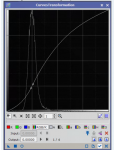
For the life of me, I cant figure out how to show a representation of the histogram when working in curves. First image is mine and the second image is borrowed from the internet showing the histogram in curves.
There is a Reference Documentation for the CurvesTransformation: Please click on the sheet of paper icon (the third icon from the right side at the bottom of the CurvesTransformation window). Select "CurvesTransformation" in the Process Explorer, click on Property Browser and again on Documentation Browser.
Do you have any questions that are not answered in this document?
At the bottom right of the process window is a "check" mark (next to the reset button) ... that turns the histogram on and off. This "setting" is in a number of other processes as well.
This site uses cookies to help personalise content, tailor your experience and to keep you logged in if you register.
By continuing to use this site, you are consenting to our use of cookies.