Thanks all for the additional input. Having considered your comments over the weekend I still felt that my test ought to produce something like the expected results, so perhaps my proxies for signal and noise weren't good enough.
Ignacio's definition of what we're measuring here is the one that I have been working to all along; by definition anything that is produces a repeatable pattern (and so can be calibrated out) is a signal, and anything that does not is noise. In a dark frame there should be no signal from photons, only signals and noise produced by heat in the sensor (dark current and dark current noise) plus signals and noise produced by the chip and camera electronics (fixed pattern - commonly called 'bias' though not techically correct for a typical CMOS sensor and read-out noise; there may be multiple sources of both but we have no way of separating them).
At present I think there is a clear difference in the patterns produced by dark current and by the 'bias'. Comparing a master bias frame and a master dark, visually there is an obvious vertical pattern of 1-2 pixel wide stripes in my master bias, overlaid by a large-scale horizontal banding pattern:

The same two patterns must exist in the uncalibrated (not bias-subtracted) master dark. A horizontal banding pattern is obvious, but visually the small-scale vertical pattern is not visible using a simple STF. Thus the banding pattern must have a greater ADU range. What isn't clear is whether the banding pattern is constant; I don't think it is since I often cannot remove it during calibration, and have to use the Canon Banding Script to minimise its appearance in the calibrated light frame.

What isn't apparent just by looking at the master dark is that there is a pattern at a scale of 4-6 pixels which shows when you do a side-by side comparison of single light frames without dark subtraction and with dark subtraction:
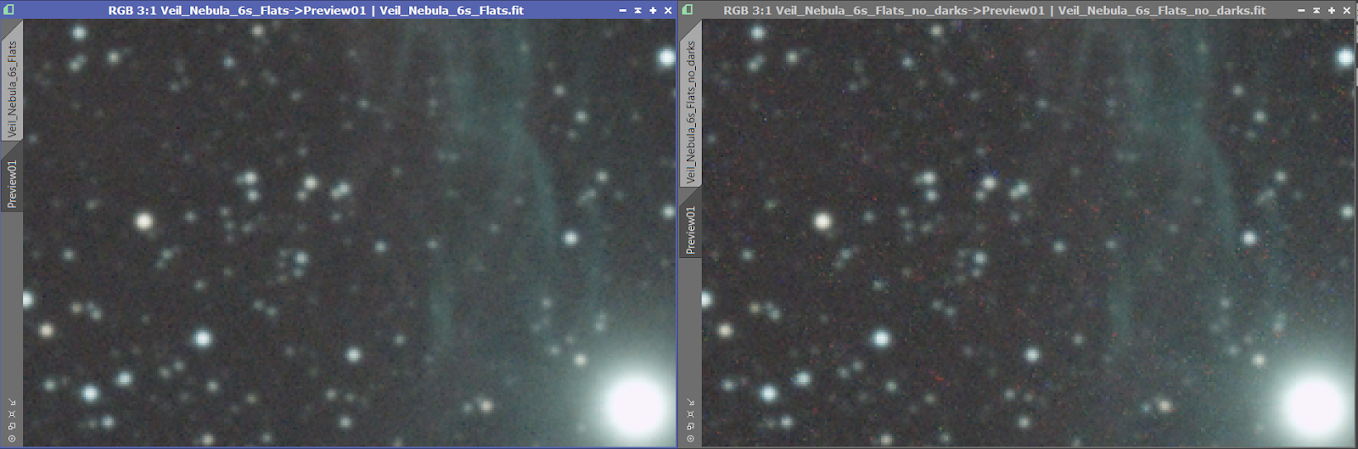
The left image has been dark subtracted, and the right one has not. Everything else is the same and I have tried to match the STF as closely as possible between the two to give a fair comparison. In the right-hand image, you can see there is an obvious pattern of red blobs at the 4-6 pixel scale. There are also similar but less obvious patterns in green and blue when I inspect the individual channels. Now to some extent it might not matter; these are single calibrated frames and when a stack is integrated the effect may reduce; certainly hot pixels do go if dithering and sufficient frames have been used, but my gut feeling (not fully investigated yet) is that large scale patterns will have some residual effect in the final image unless a very large number of frames and a lot of dithering is used.
Anyway, back to my tests: I do not concur with the suggestion that the SNR in larger stacks will reduce because we can't separate signal from noise. Even if the intermediate scale pattern in the dark current is too much like noise to be distinguished from real noise, we still have the 'bias' fixed pattern in the image, plus the large scale banding which is not visually apparent in a single frame but appears in a stack of darks.
From my earlier graphs we know that that the mean of the images is fairly constant (it reduces slightly as standard deviation goes up, which we know is due to the Canon pre-processing). We also know from the graph that for the first 120 frames or so the standard deviation only increases slightly, and thus the rough SNR starts out at about 29.9dB for the best frame, and only drops to 28.4dB by the time we get to frame 120. As per the purple line on the first graph, integrating these frames should see the SNR increase.
Now if we work on the premise that the dark current pattern is too much like noise to be measured using the standard deviation, the SNR improvement might not be as much as we'd first estimated, but it should still increase due to the 'bias' fixed pattern and the large scale banding. So I went back to the set of test integrations (I used those with no pixel rejection to avoid any possible confusion arising from rejection effects).
Instead of measuring the means and standard deviations of the whole image, I thought I'd try to avoid any skewing of results due to hot pixels (which appear pretty consistent across all the test integrations as we'd expect). I created eight previews in small regions with no hot pixels and use the preview aggregator to extract them to one image and then measured the mean and standard deviation of the result. I repeated this for all of the test integrations plus the highest SNR single dark frame - taking care to duplicate the preview locations exactly for all images.
I then plotted the results below:

The purple line is the theoretical SNR improvement that I calculated from the means and standard deviations of the individual darks (same as the first graph). The orange line is the SNR from integrating darks of different stack sizes and measuring the whole image (including hot and cold pixels), The blue line is my new measurement from the aggregated previews of each master dark (i.e. excluding hot pixels).
Now I think I am making a bit of progess. There is a clear and obvious increase in SNR from 1 to 30 frames (it is also there in the orange line but hardly visible in terms of dB), plus there is the slight tailing off of SNR we expected to see by including the really noisy frames 179-183. In between the SNR is not really doing much - up and down very slightly, but at least it is not a constant decline.
What I'd really like to do is also exclude the cold pixels and see whether something clearer emerges or not. Doing that by means of previews is not going to be so easy. For one thing it is not so easy to spot cold pixels (whereas hot ones are obvious), plus I think I might struggle to find reasonably large regions that are free of hot and cold pixels.
One idea that occurred to me was to do a bit of PixelMath and replace all hot and cold pixels (those above or below some threshold values) with the mean value of that dark frame and then measure the whole frame for the stats. Does that sound reasonable or not? I guess the other approach would be to create a defect map from the biggest stack and use that to replace the same hots/colds in all images for maximum consistency? I did try that process once before, but not sure if I can avoid introducing spurious effects on the numbers.
A final wrinkle might be to apply the same processing to all the individual dark frames prior to taking their means and standard deviations. This would allow a much more accurate 'grading' of the frames by their individual SNRs. Of course one would use the unmodified darks to create the master, but based on the grading created from the modified ones.


