|
The Curves Window |
|
|
|
Zooming and Panning Controls and Functions Zooming and Panning with Temporary Keyboard Switching Combinations |
||||||||||||||||||||||
|
|
||||||||||||||||||||||
|
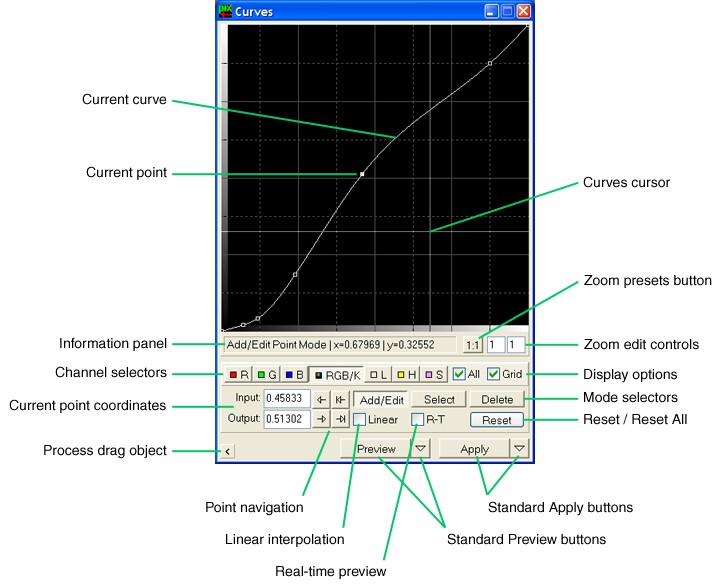
The Curves window is the standard interface for CurvesTransform:
On the Curves window, interpolated curve functions, curve points, and numerical point coordinate values, use the following coordinate system:
Most available space on the Curves Window is dedicated to work with interpolated curve functions and curve points. The current curve is drawn for the currently selected channel, which can be selected with the appropriate channel selectors. Each curve point is drawn as a small square over the curve. The current point is drawn filled with white pixels. You can create, delete and edit points for the current curve by clicking and dragging on the curve plotting area of the Curves Window. For these purposes, there are three operational modes:
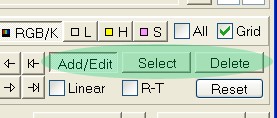
To select one of these modes, click the corresponding mode selector:
or use one of the temporary mode switch keyboard combinations:
ATTENTION: Horizontal coordinates (that is, input values) of both curve end points cannot be changed on PixInsight's Curves window. This has been made to help preventing uncontrolled histogram clippings. if you want to do this kind of clippings, use the Histograms window, where you can always know how many pixels you are throwing away.
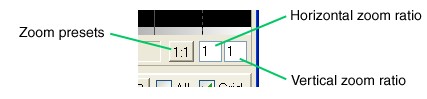
You can define extremely complex and accurate curves in PixInsight, thanks to the zooming and panning functions implemented in the Curves window. Zoom ratios can be independently adjusted for horizontal and vertical axes from 1:1 to 99:1. Note that zoom ratios affect every element of the graphical curves interface: interpolated curves, point positions, grids, cursor range, etc. When a value greater than 1 is specified for horizontal or vertical zoom, scroll bars appear on the bottom or right edges, respectively, of the curve graphic. You can use these scroll bars and their associated scroll thumbs and arrows to navigate on the magnified function space. You can also navigate zoomed curves by temporary keyboard combinations, as explained below. The zoom presets button resets zoom ratios to 1:1 (no zoom) by default. When the Ctrl key is pressed, the zoom preset changes to 2:1, and if Shift-Ctrl is pressed, the zoom preset changes to 4:1. Note that the button caption varies as you press these keys.
Zooming/panning keyboard combinations in image windows and on the Curves window work in a very similar way:
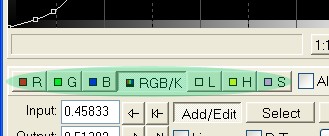
For example, to zoom at a desired location on the current curve, press Ctrl-Spacebar and click on the location of interest. You can do this repeatedly. When you want to decrease zoom, do the same but include the Shift key. Finally, return to 1:1 ratio quickly by clicking the zoom presets button with no key pressed. This works just the same way as does for image windows, with the exception that on Curves you can't define a rectangular zoom area. The Histograms and Color Saturation windows also have the same zooming/panning functionality. The curve drawn on the Curves window corresponds to the currently selected channel. You can change this selection by clicking one of the channel selectors:
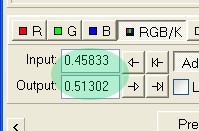
To learn what these channels actually refer to, read the documentation on the CurvesTransform process. In these two edit controls you can type new coordinate values for the current curve point:
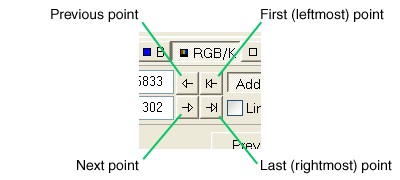
To see how the current point effectively moves to a new location defined by new coordinate values just typed, press the Enter key, or focus other control on the Curves window. You can select any point of the current curve by clicking one of these buttons:
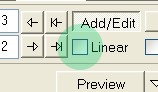
When the Linear check box is checked, linear interpolation is used for the current curve; otherwise, cubic splines are used to interpolate a smooth curve function. Each interpolation scheme has its own pros and cons for curve definition. In PixInsight LE 1.0, different interpolation modes cannot be selected for individual curve points.
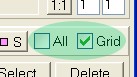
When the All check box is checked, all non-identity curve functions are drawn; otherwise only the current curve is drawn. This is useful for comparison and reference purposes. Identity curves are those consisting just in two ending points located at 0,0 and 1,1, respectively. The Grid check box controls visibility of grids, including graduated gradients on both axes.
By clicking the Reset button, all intermediate points of the current curve are deleted, and the ending points are placed at 0,0 and 1,1, respectively. This resets the current curve to an identity function. If the Ctrl key is pressed while clicking the Reset button, all curves are reset the same way, that is, for all available channels. Note that the caption of the Reset button changes to Reset All when you press the Ctrl key and Curves is the active window.
Readouts work when you click on any view (image or preview) of an image window in the Readout Mode. In this mode, while the mouse button is held down, readout values are calculated for the cursor coordinates and sent to the Histograms, Curves and Color Saturation windows. Readout pixel values are shown over the current curve function, but no parameter is changed. For RGB color images, vertical red, gree and blue lines, respectively, are drawn at the corresponding coordinates over the curves function space. For grayscale images, only a vertical readout line is drawn. The way readout values are calculated is governed by the current readout options settings.
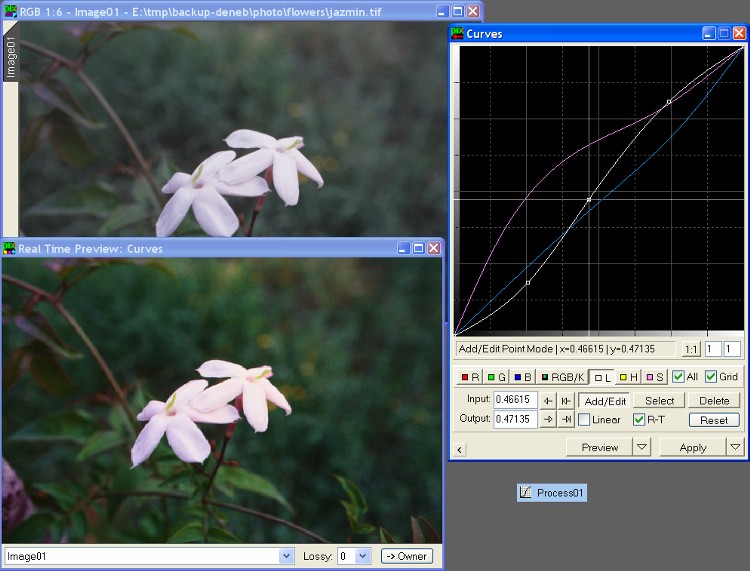
If you check the R-T check box, the Curves window will gain ownership of the Real Time Preview window, which this way will show in real time how changes made to curves functions would affect a selected view. The real-time preview system works for the Histograms, Curves and ColorSaturation windows. Below is a screenshot showing the Real Time Preview window working for Curves.
By checking and unchecking the R-T checkbox, you can turn real time preview on/off to quickly evaluate changes. Luminance and saturation curves require considerable computing effort to transform pixel values between the RGB space to CIE XYZ and L*a*b* spaces. This includes power functions to linearize RGB values and matrix transforms. Despite the fact that fast LUT-based (look up tables) algorithms have been used to implement real-time previews in PixInsight, if your computer is slow you may experiment some difficulties with real-time previews of luminance and saturation curves. A trick to speed up real-time previews is to use them for small preview objects previously defined at relevant areas, instead of full images. |
||||||||||||||||||||||